Adirondack Landslide Monitoring with Multispectral Imagery
Abstract
This mini project tests whether annual satellite embeddings and terrain data can be used to map recent landslides in the eastern High Peaks of the Adirondacks and explore how slide activity relates to heavy rainfall. Annual land-cover maps (2018–2024) were generated from a Random Forest classifier trained on Google’s 64-band satellite embeddings and simple classes (forest, water, bare rock). Change detection between years highlights pixels that transition from forest to bare rock as candidate landslides, which are then filtered using slope, elevation, and masks for built-up areas.
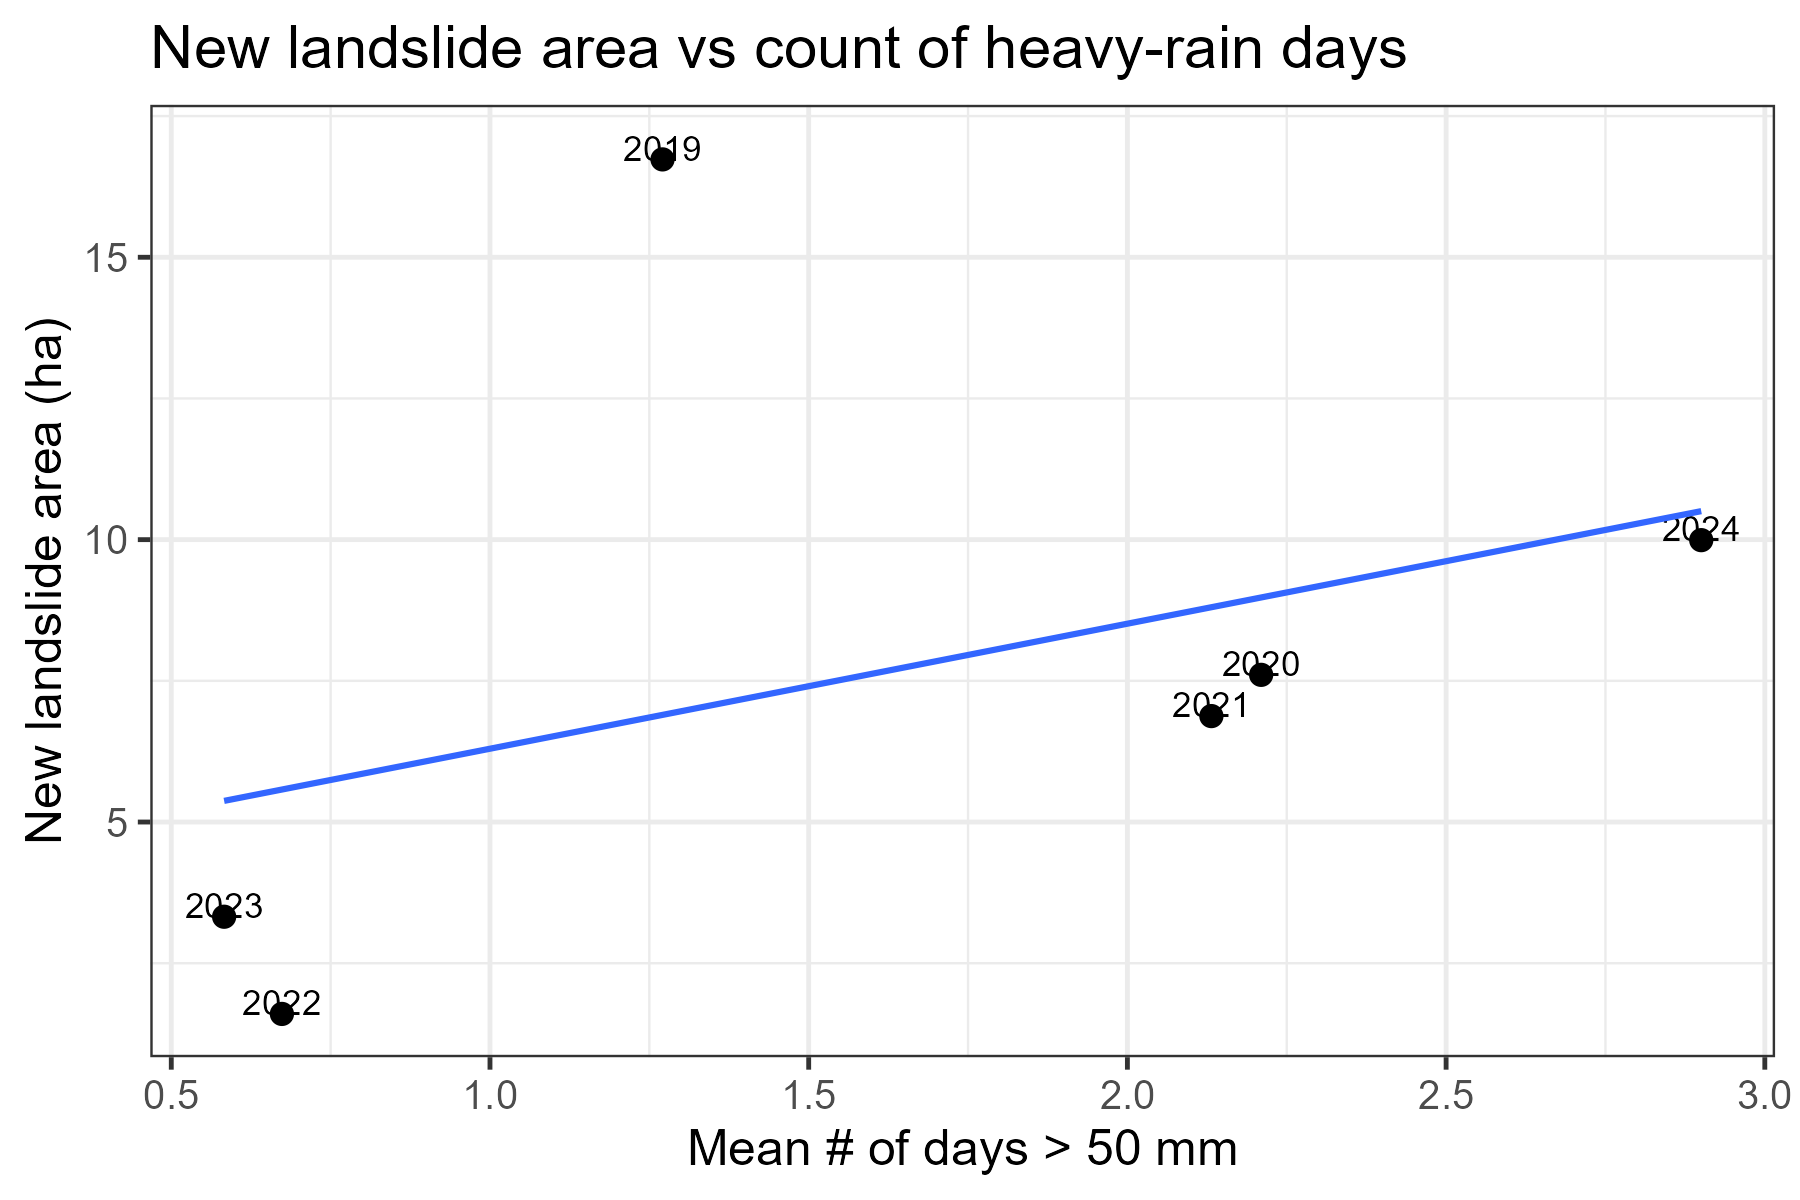
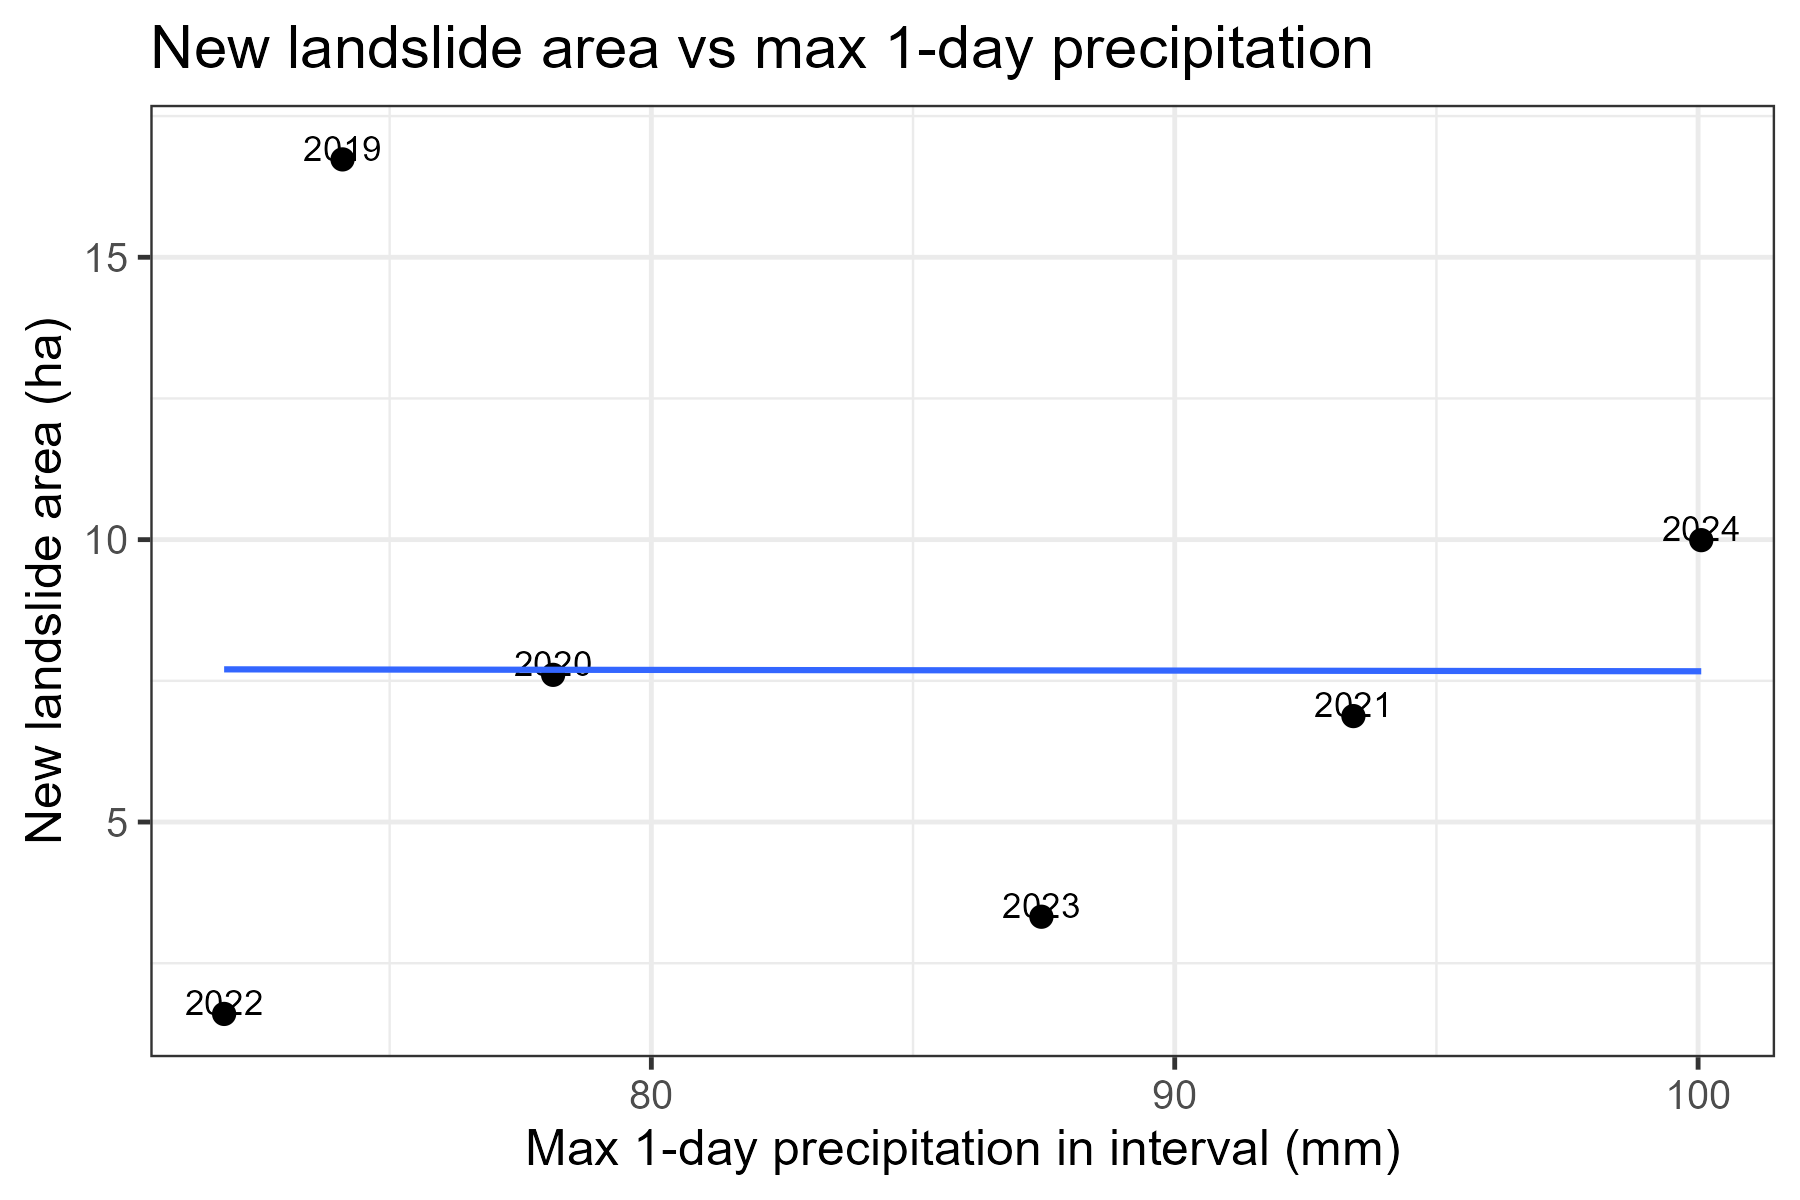
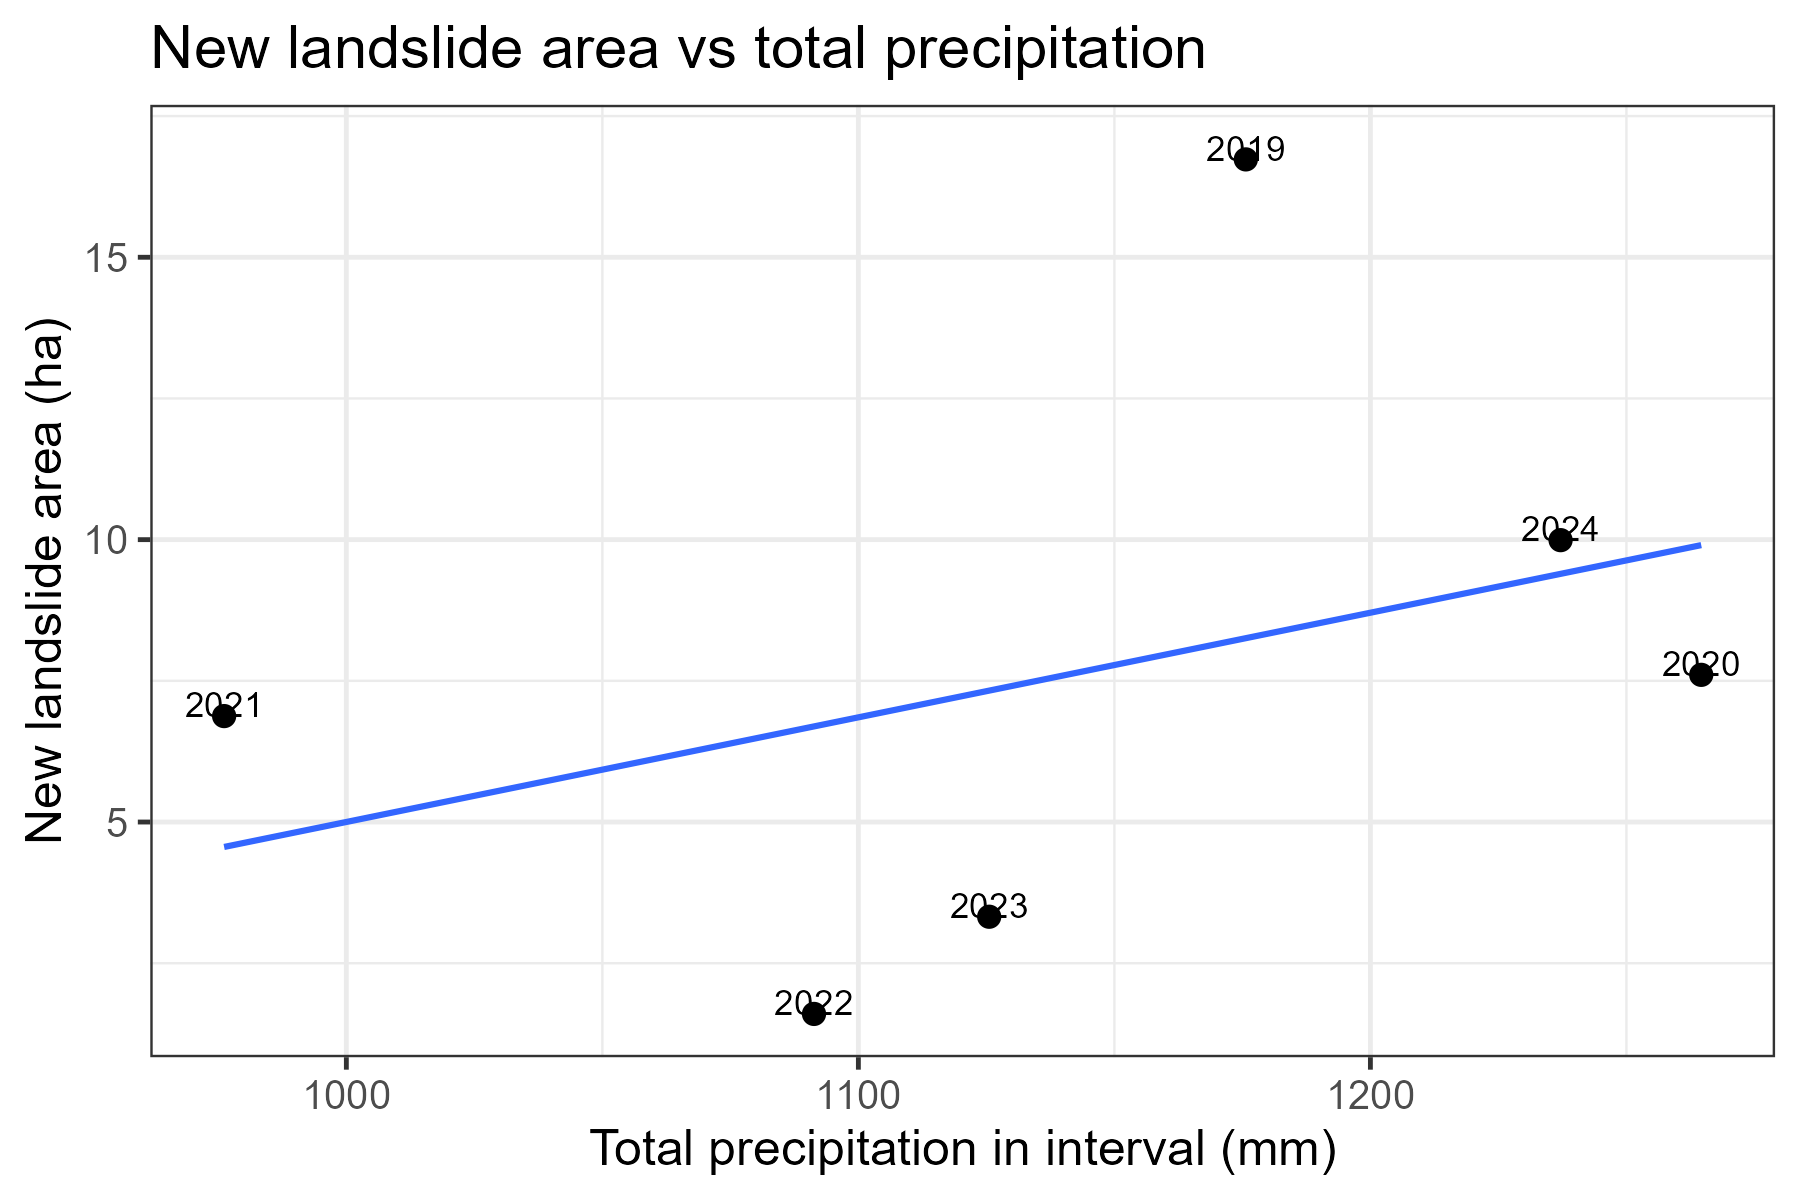
The resulting inventory captures many large, obvious slides but still confuses summit bedrock, sparsely vegetated slopes, and some human-built surfaces with true failures. Scatterplots compare new slide area to several rainfall metrics derived from CHIRPS precipitation data. Relationships with storm-scale rainfall are suggestive but noisy, reflecting both data limitations and the coarse temporal resolution of yearly composites. Overall, the project shows that embeddings are a useful starting point for regional landslide mapping, but more detailed classes, stronger terrain masks, and higher-frequency imagery are needed before this approach can support operational monitoring.
Introduction
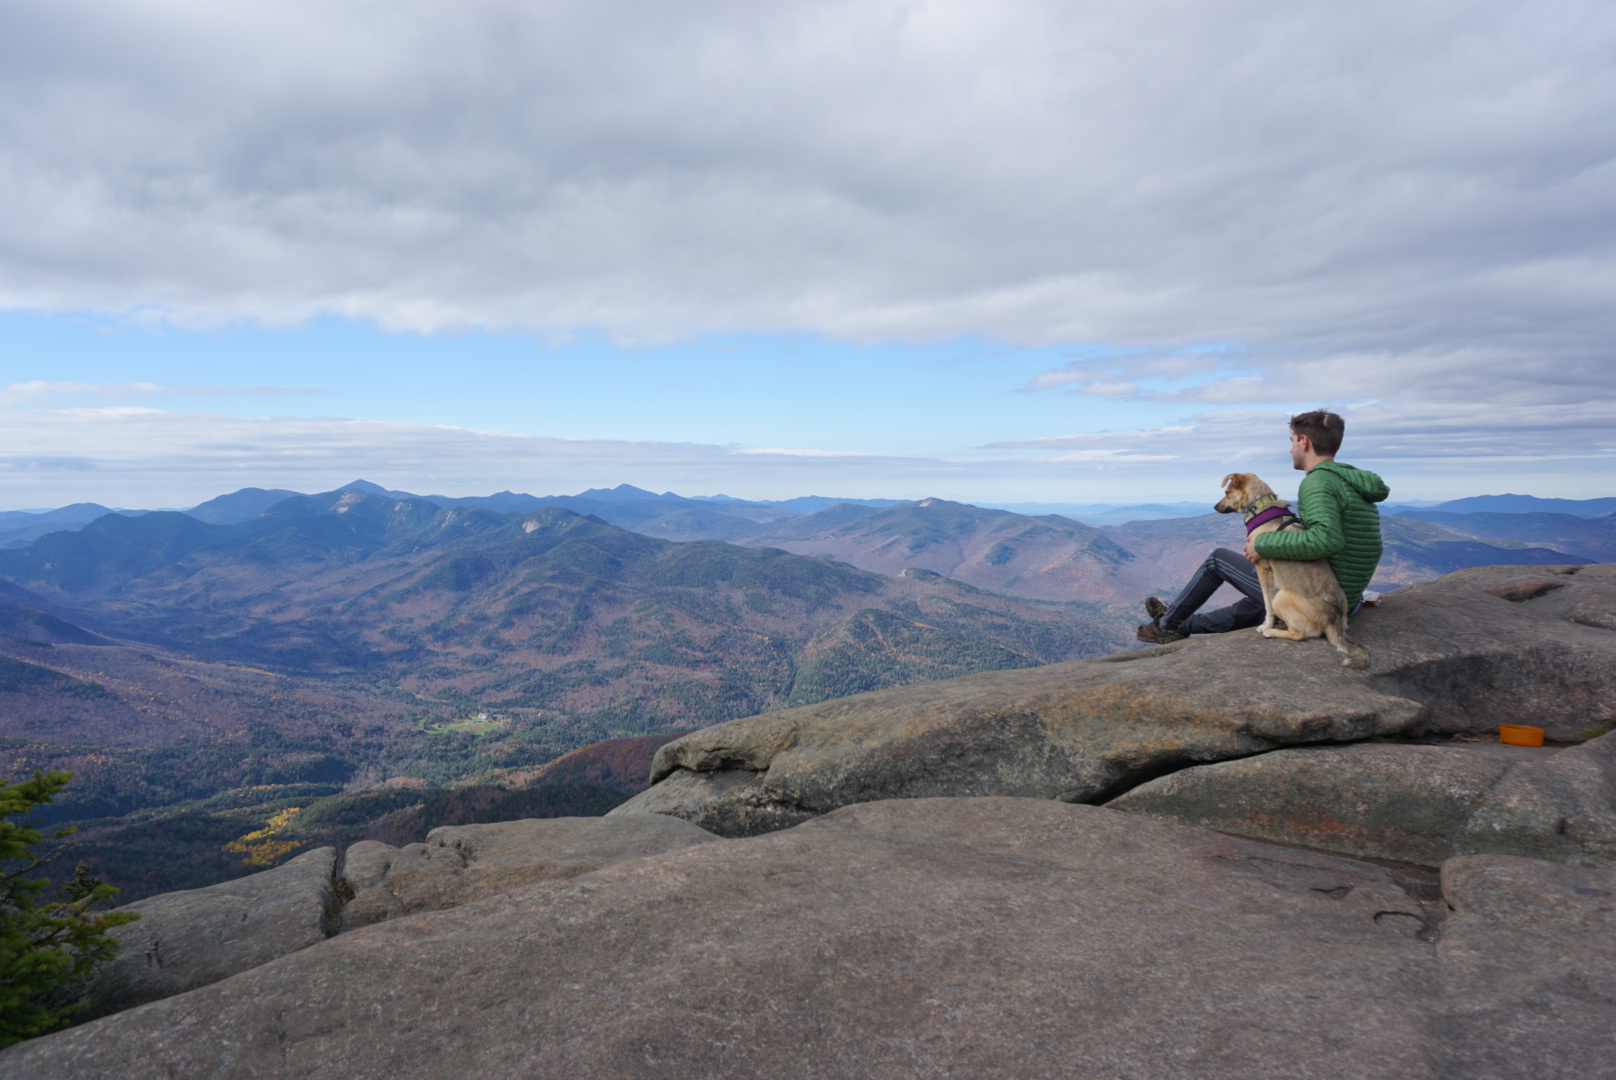
This is an ongoing, multi-phase project to map and monitor landslides in the eastern High Peaks region of the Adirondacks using satellite imagery, NAIP aerial photos, and terrain data. The Adirondacks experience steep topography, intense storms, and thin soils, which combine to produce frequent shallow landslides in remote terrain.
For this mini project, the main questions are:
- Where have new landslides occurred between 2018 and 2024 in the eastern High Peaks?
- How well can annual satellite embeddings separate new landslide scars from long-exposed summit bedrock and human-built surfaces?
- Is there any clear relationship between new landslide area and heavy-rainfall metrics over the same period?
The current workflow focuses on distinguishing newly exposed bare rock from forest and water to identify landslides that occurred between 2018 and 2024. Longer term, the goal is to integrate a wider range of satellite sources to increase the frequency of imagery so that landslides can be detected and mapped soon after they occur, especially in remote parts of the Adirondacks where new slides often go unnoticed.
Interactive Map
This web map combines my yearly landslide inventory (2018–2024) with NAIP and Sentinel-2 imagery. Landslides are symbolized by the year they first appear.
Map controls
- Zoom: + / − buttons in the top-left
- Legend: icon in the top-right
- Layers: button in the bottom-right (switch imagery and overlays)
- Red pins: field photographs
Swipe comparison: left – 2017 NAIP aerial imagery (1 m); right – 2025 Sentinel-2 RGB (10 m)
The 2025 Sentinel-2 image on the right side of the swipe reveals several new landslides that are not yet classified in the inventory; the map and time series will be updated once the 2025 embeddings dataset is released.
Study Area & Data
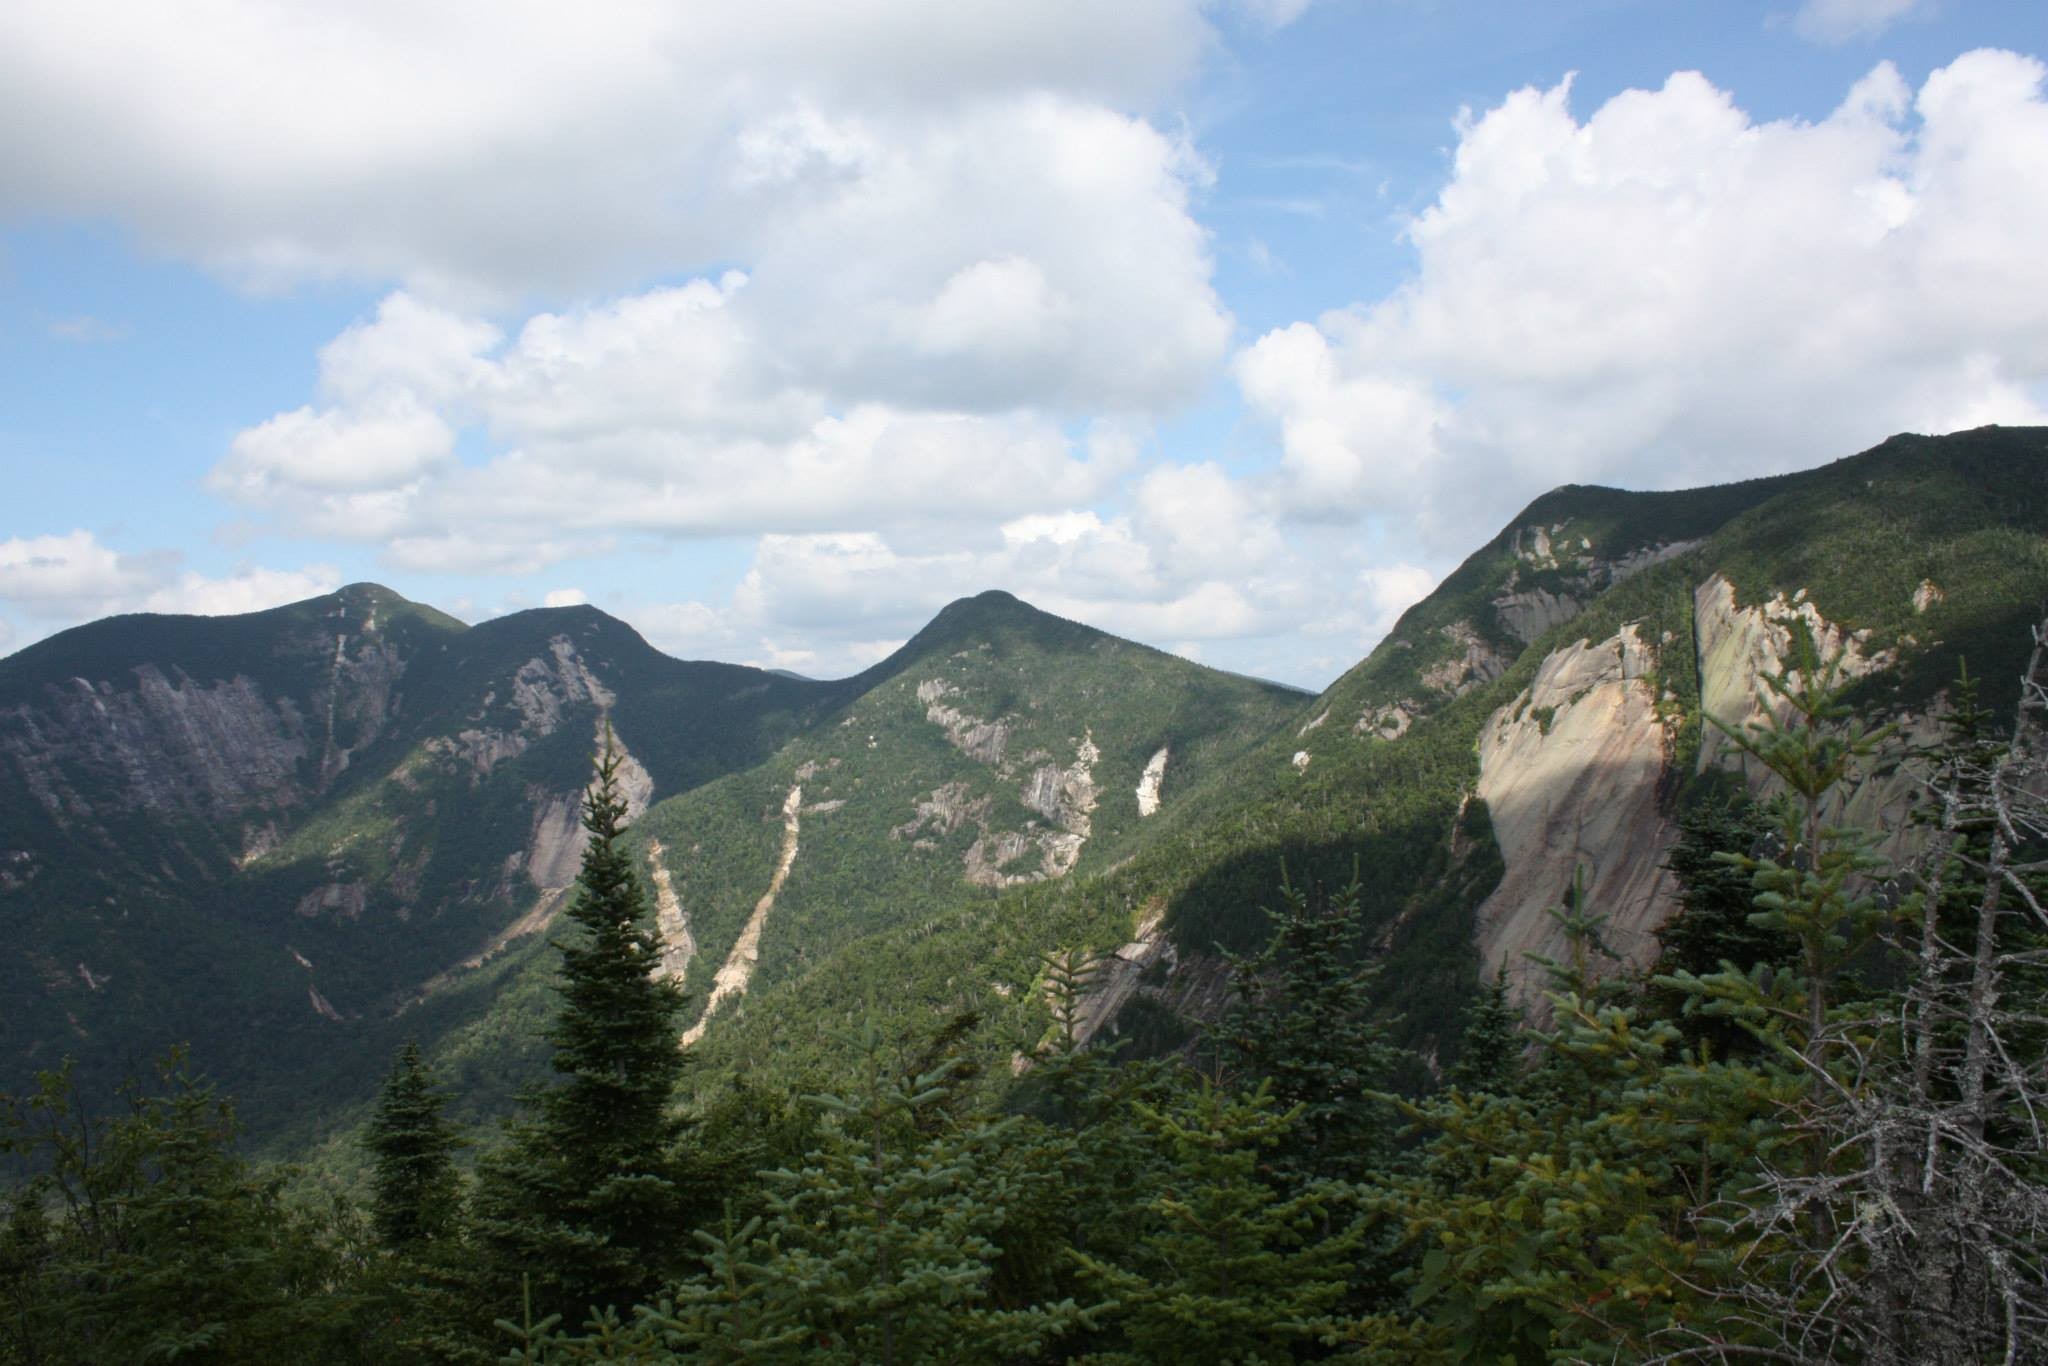
The study area covers the eastern High Peaks region of the Adirondacks in Upstate New York, including well-known mass-wasting slopes around the highest peaks in New York.
The current phase uses:
- NAIP 1-m aerial imagery (2017, 2019, 2022) for high-resolution context and validation.
- Multi-sourced multispectral embeddings for annual land-cover classification from 2018–2024.
- Sentinel-2 RGB imagery (10 m) to visualize recent years, including the 2025 landslide season.
- Digital elevation models and derived slope/hillshade to help separate steep rock faces from flatter summits and human-built surfaces.
For this class project, land-cover classes were intentionally kept simple: Forest, Water, and Bare Rock. Newly exposed bare rock between time steps is interpreted as potential landslide area, which is then refined using elevation and slope masks.
Methods
The workflow is built around yearly land-cover classification, change detection, and terrain-based filtering. All core classification and change detection is implemented in Google Earth Engine, with summary tables exported for further analysis and plotting.
-
Feature stack and classifier. Annual Google Satellite Embedding images
(
GOOGLE/SATELLITE_EMBEDDING/V1/ANNUAL) provide 64-band feature vectors at 10 m resolution. I sampled those embeddings within hand-drawn training polygons (forest, bare rock, water) and trained a Random Forest classifier for each time interval (2018–2024). - Training data. Forest, bare rock, and water polygons were digitized using NAIP imagery, Sentinel-2 RGB composites, and local knowledge of known slides and summits in the eastern High Peaks. Labels were kept intentionally simple for this phase to focus on separating forest from exposed rock and open water.
- Post-processing and smoothing. After each yearly classification, I cleaned the map to get rid of speckled noise. A neighborhood filter replaced isolated pixels with whatever class most of their neighbors had, and then very small patches were removed so the final result only kept larger, continuous landslide areas. A mask was also applied to remove pixels that changed from bare rock to forest to bare rock in consecutive years to remove the sparsely vegetated bare rock areas that are on the border between the forest and bare rock classifications.
- Terrain and built-area masking. ESA WorldCover 2021 was used to mask built-up land-cover classes, while a 10 m USGS 3DEP DEM provided slope thresholds to focus on steep, landslide-prone terrain. Low-slope “bare” pixels and obvious infrastructure are largely removed at this stage, though not perfectly.
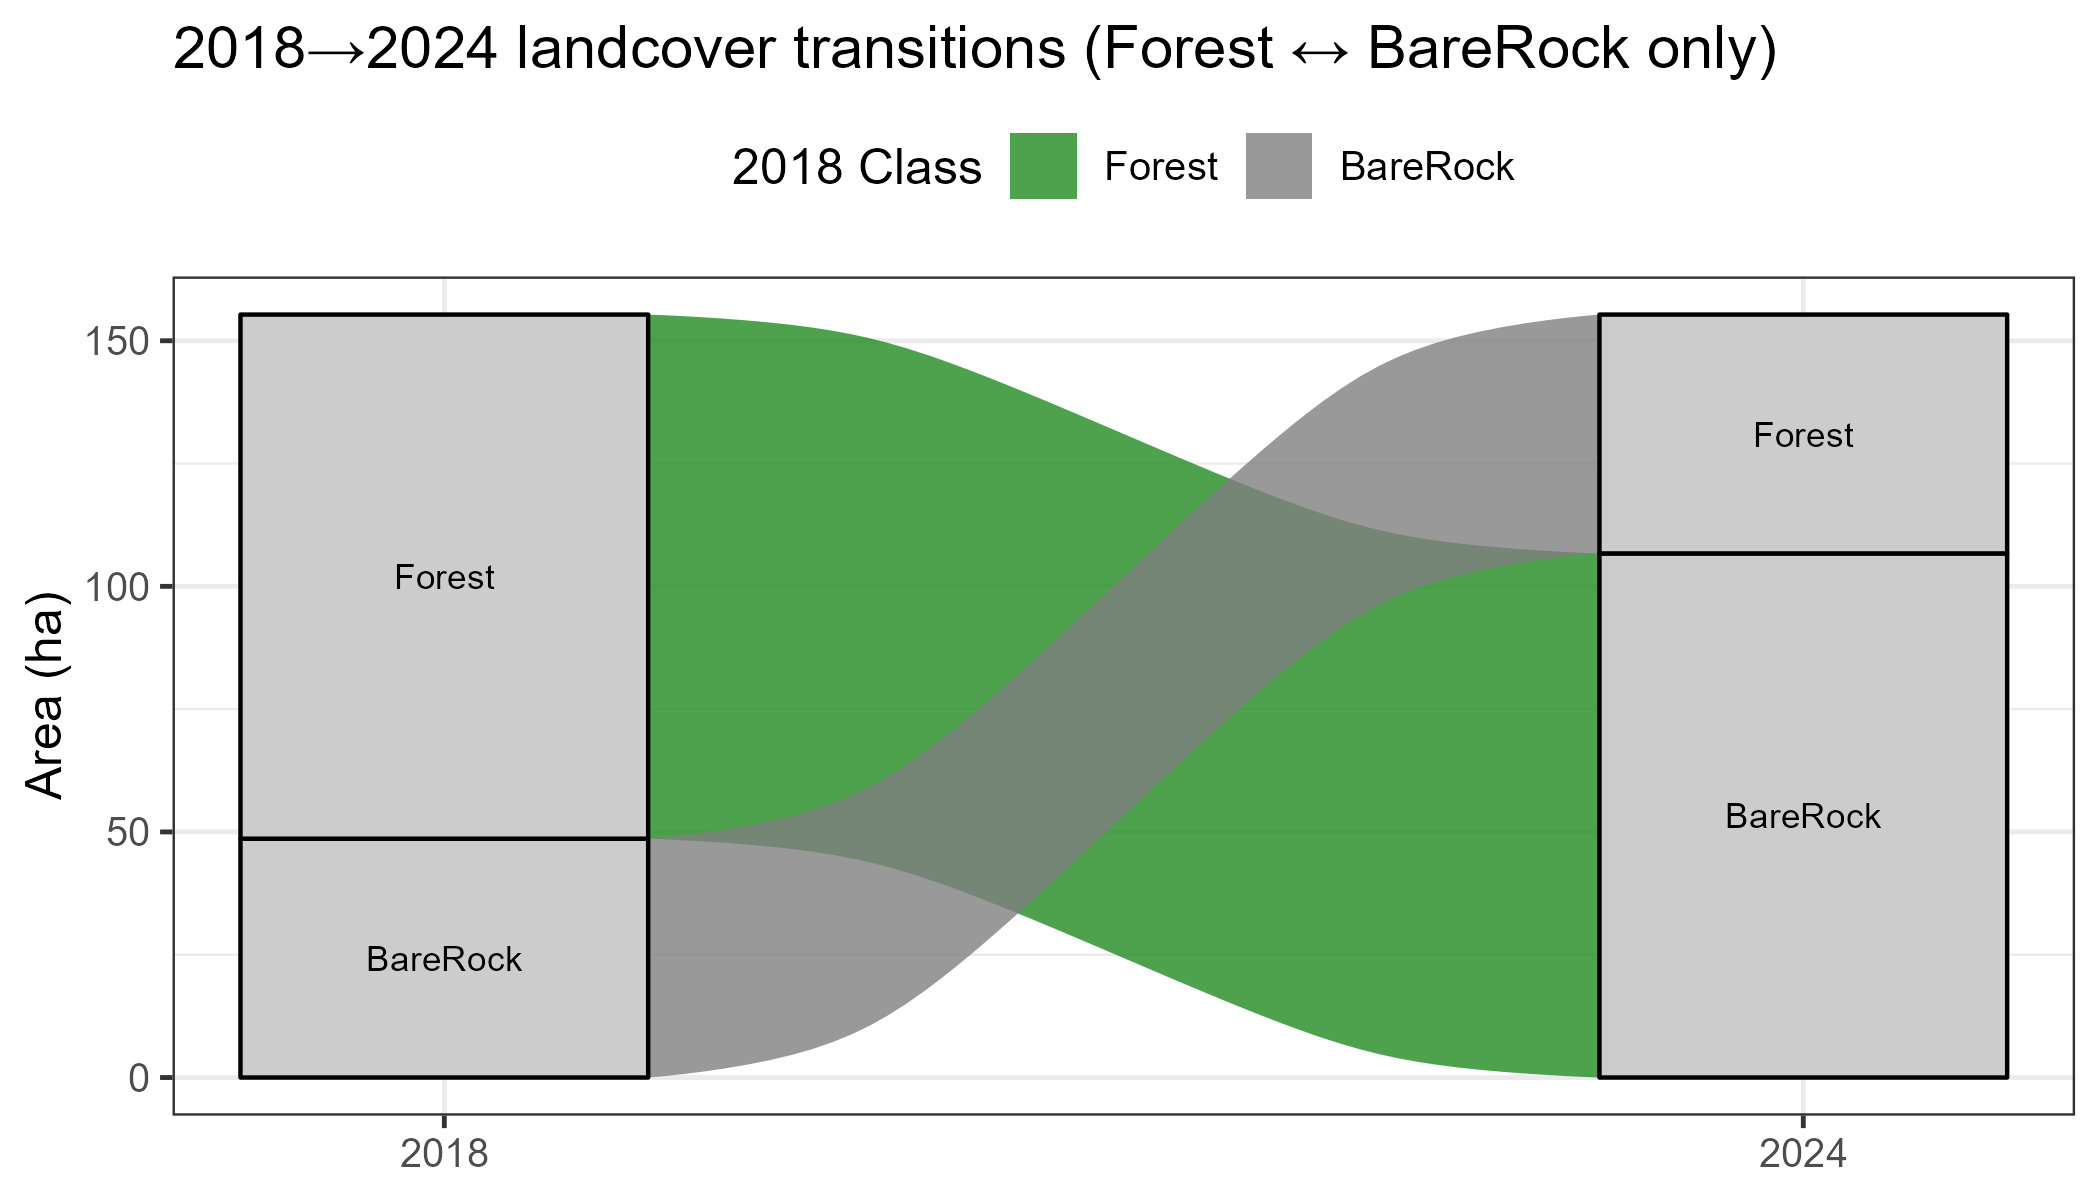
- Change detection. Consecutive annual maps were compared to flag pixels that transitioned from forest to bare rock (new landslide candidates) and from bare rock back to forest (revegetation). These change pixels were converted to polygons, filtered by minimum area, and tagged with the first year they appeared as bare rock.
- Visual validation. NAIP (1 m) and Sentinel-2 (10 m) imagery were used to visually check new-slide polygons, correct obvious artifacts, and refine the separation between true slides, long-standing summit exposures, and sparsely vegetated slopes.
The project has already gone through several rounds of trial and error. One of the biggest issues is that fresh landslide scars and high-elevation summit bedrock share nearly identical spectral signatures in both the embeddings and the Sentinel-2 imagery. Without extra context, the classifier labels all of them as “new bare rock,” which increases annual landslide area in zones that have actually been exposed for years or decades.
Another persistent challenge is separating human-made surfaces (roads, parking lots, buildings) and sparsely vegetated, rocky slopes from true mass-wasting features. While human-made surfaces often have a gentle slope and a slope mask can remove these misclassifications, the summit exposures can have slopes of the same degree as some landslides. Additional DEM-derived constraints (elevation bands, slope breaks, curvature), explicit masks for known infrastructure, and a more comprehensive class scheme (for example forest types, early regrowth, wetland, grass, agriculture) are key targets for the next phase of the workflow.
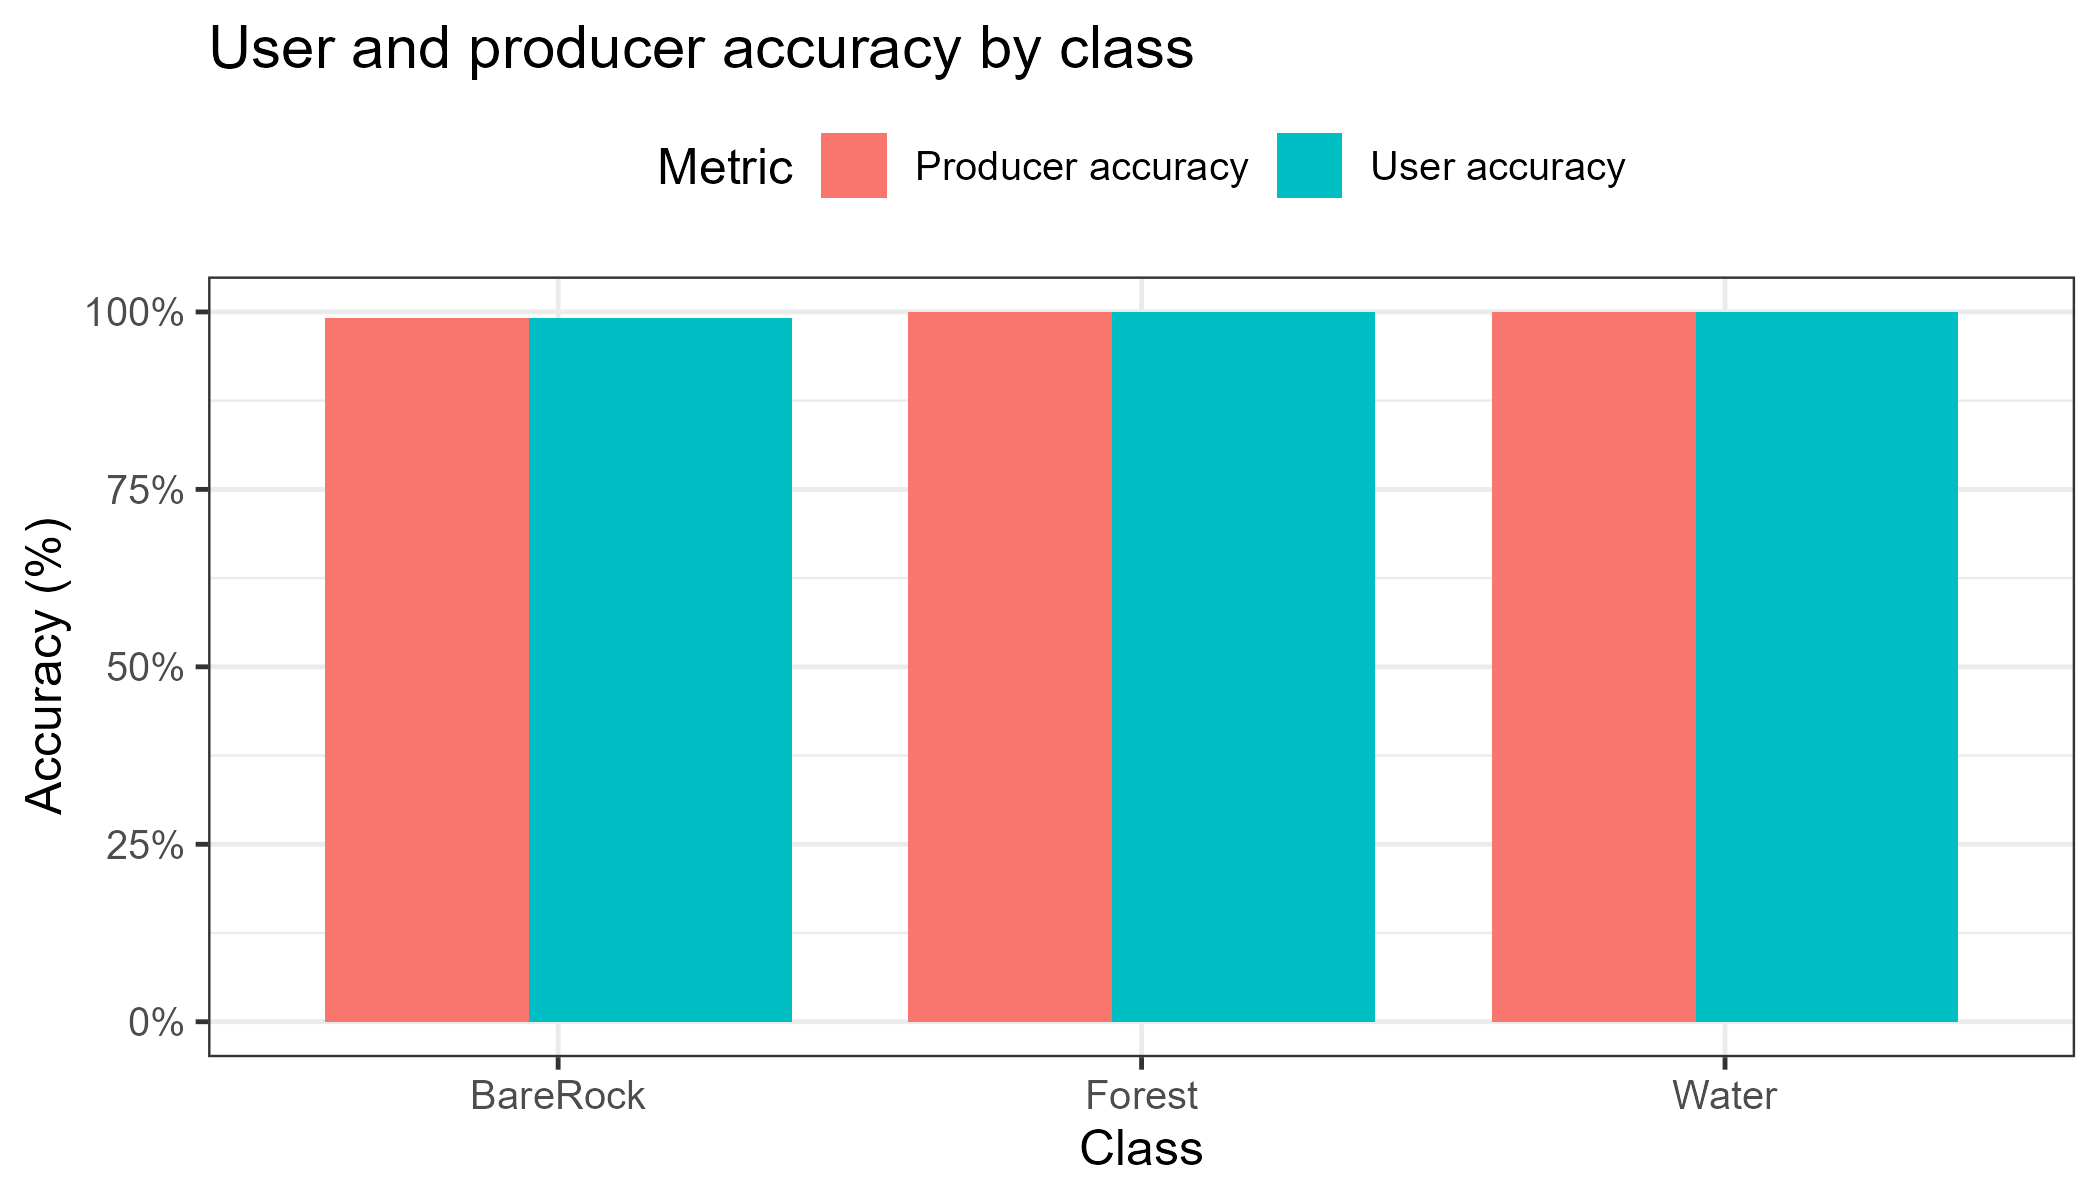
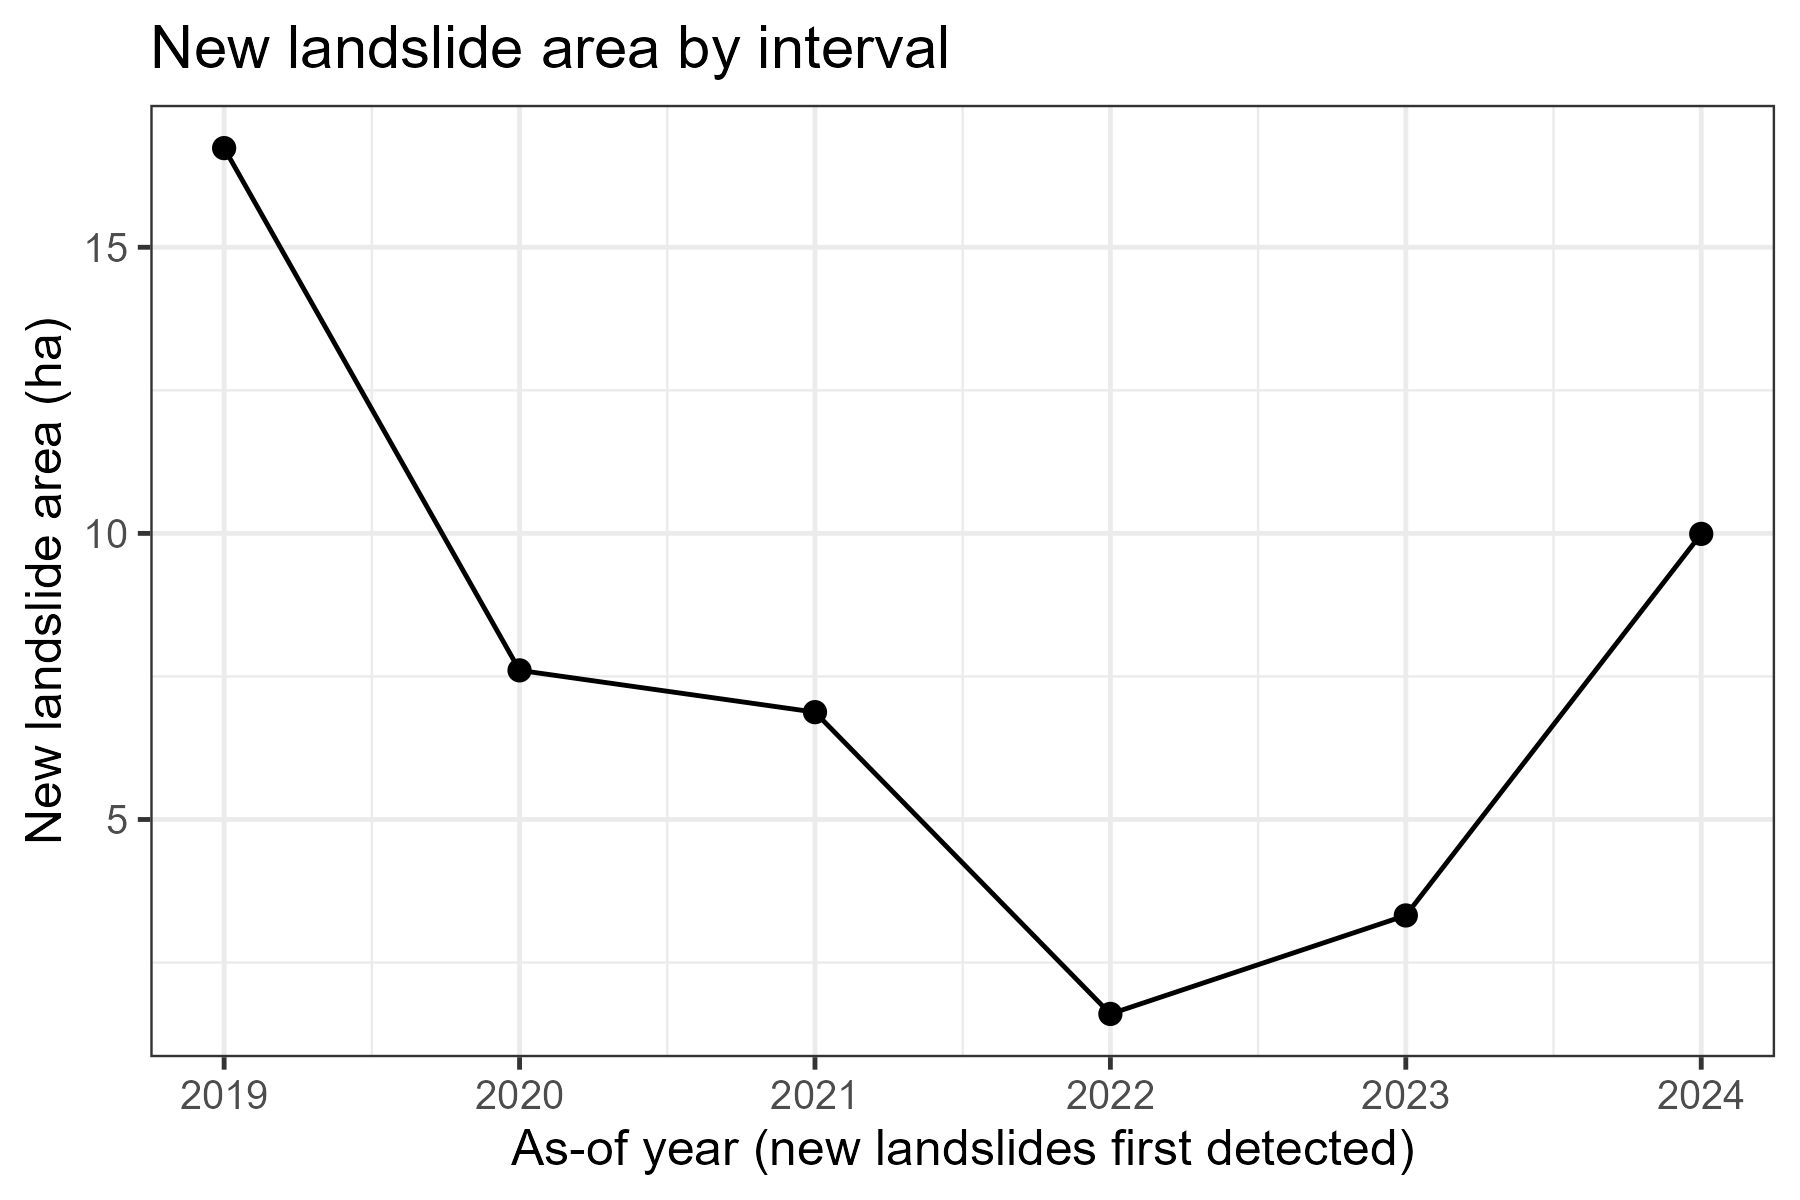
Results
The figures below summarize how well the current classification performs and how landslide area changes through time. These are preliminary results from the trial phase, useful for diagnosing problems, but not yet something I would publish without further refinement.
Discussion
The current maps successfully capture many large, obvious landslides but still struggle in a few consistent ways:
- Summit bare rock vs landslide scars. Summit bedrock shares the same spectral signature as exposed bedrock from landslides. Without explicit summit masks, summit surfaces are repeatedly classified as bare rock.
- Sparsely vegetated slopes. Some areas with thin soils or open canopy that have changed very little since 2018 still classify as “new landslides”. This may be related to the time of year the satellite images are taken and the state of vegetation growth.
- Human-built surfaces. Roads, clearings, and infrastructure sometimes pass the terrain filters and are classified as bare rock.
- Noise filtering vs small slides. Smoothing and minimum-area thresholds remove the salt and pepper effect but can also erase genuinely small landslides or narrow scar margins, especially on steep, confined slopes. Thresholds that work well for large, obvious scars can be too aggressive for small failures.
- Resolution and timing of datasets. The 10 m embeddings and Sentinel-2 imagery are not ideal for narrow scars or complex boundaries, and annual composites can capture slopes at different points in the growing season. This limits detection of very small slides and makes some year-to-year changes sensitive to phenology and shadow rather than true mass wasting.
- Dependence on a single embedding product. The current workflow relies on Google’s annual satellite embeddings. If that product changes, is reprocessed, or becomes unavailable, the classifier and thresholds may need to be retrained, which makes long-term consistency harder to guarantee. The release of one dataset per year also results in low temporal resolution.
- Limited ground truth. Accuracy checks rely mostly on NAIP, Sentinel-2, and personal knowledge of known slides rather than dense field mapping. In steep, remote terrain, some mapped “errors” may actually be unmapped slides, while some accepted polygons may still be misclassified.
Near-term work will focus on:
- Using DEM-derived masks (elevation bands, slope, curvature) to remove summit exposures and low-slope built areas.
- Bringing in building and road layers to explicitly mask human infrastructure.
- Expanding the class set beyond forest, water, and bare rock to include forest types, early regrowth, wetland, grass, and agriculture to track revegetation and reduce confusion near slide margins.
- Refining the rainfall–landslide analysis with storm-scale metrics and better temporal alignment between precipitation events and available imagery.
- Extending the historic inventory as far back as possible by combining older aerial photography, NAIP, and any usable pre-2018 satellite archives to estimate landslide rates through time.
Conclusion
Even in this early phase, the project has been useful for understanding where automated approaches to landslide mapping break down. Summit bedrock, sparse vegetation, and human-built surfaces all look more “landslide-like” to the classifier than they should. Working through those problems is the main focus of the next phase, along with incorporating more frequent, higher-resolution imagery for years like 2025 that were especially active.
Long-term, the goal is for this to function as an operational landslide-monitoring tool for the Adirondacks: regularly updated maps generated by an automated workflow, alerts for newly detected scars, and a public-facing web map for hikers, land managers, and researchers.
Works Cited
-
Google Satellite Embedding (Annual, 10 m).
Multiband representation of yearly surface reflectance used as the primary feature stack for
land-cover classification (2018–2024). Accessed via Google Earth Engine as
GOOGLE/SATELLITE_EMBEDDING/V1/ANNUAL. -
Sentinel-2 Surface Reflectance (L2A).
10–20 m multispectral imagery used for RGB visualization and contextual checks of landslide scars,
including the 2025 scene over the eastern High Peaks. Accessed via Google Earth Engine as
COPERNICUS/S2_SR_HARMONIZED. -
NAIP Aerial Imagery (1 m).
High-resolution orthoimagery used for manual validation of landslide polygons and as an optional
basemap layer in the web map (2017, 2019, 2022 scenes). Accessed via Google Earth Engine as
USDA/NAIP/DOQQ, and published as tiled imagery in ArcGIS Online. -
USGS 3D Elevation Program (3DEP) DEM.
10 m digital elevation model used to derive slope and hillshade, and to help separate steep
landslide-prone terrain from flatter human-built surfaces. Accessed via Google Earth Engine as
USGS/3DEP/10m. -
ESA WorldCover 2021 (10 m).
Global land-cover product used to mask built-up areas and to identify forest-capable zones.
Accessed via Google Earth Engine as
ESA/WorldCover/v200/2021(bandMap). -
CHIRPS Daily Precipitation.
Climate Hazards Group InfraRed Precipitation with Station data, used to compute total precipitation,
heavy-rain days, and maximum 1-day rainfall for each landslide interval (2018→2019 through 2023→2024).
Accessed via Google Earth Engine as
UCSB-CHG/CHIRPS/DAILY. - ArcGIS Online Basemaps and Services. Esri Terrain with Labels basemap and hosted imagery and feature services used to serve the interactive landslide inventory, NAIP mosaics, and Sentinel-2 RGB composite in the web map.