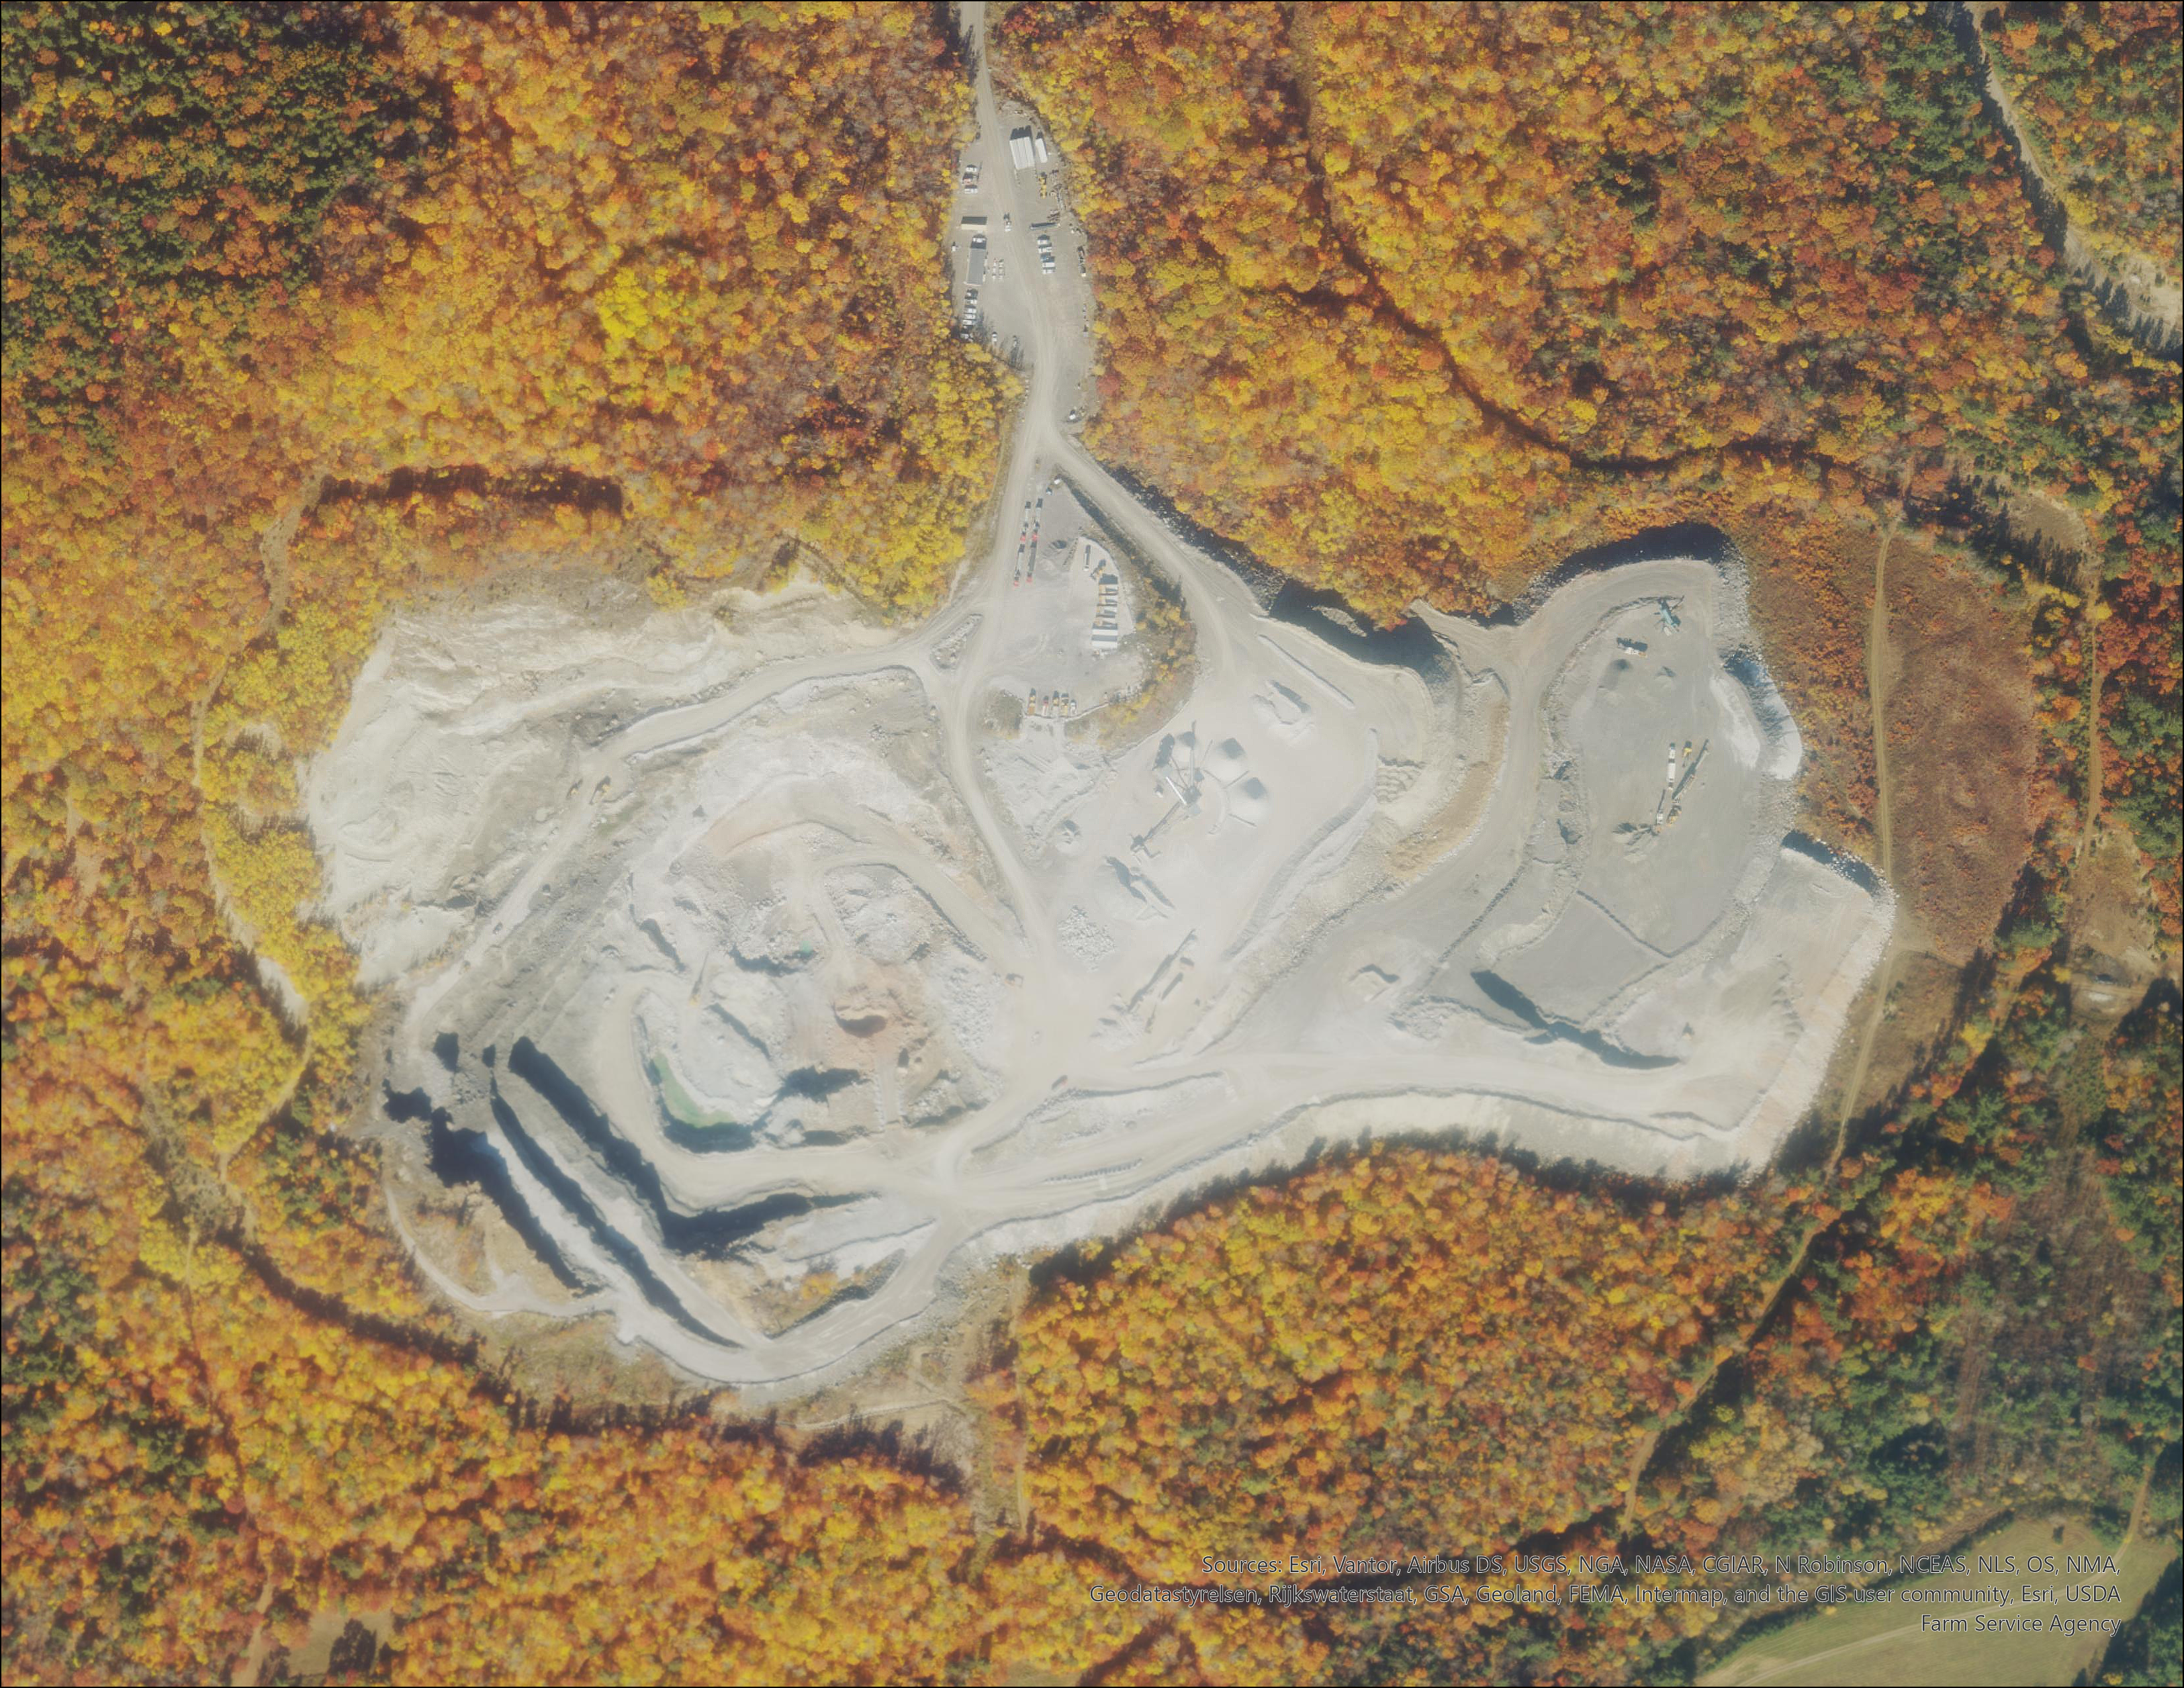
Oak Hill pit in Lewis, New York, shown in high-resolution aerial imagery. (2022)

Location of the Oak Hill pit within New York State.
Oak Hill Minimum Elevation Surface Model
This project builds a “minimum temporal elevation” surface for the Oak Hill pit to better reconcile modeled geology with actual mined topography and support other mine-planning and engineering tasks. Multiple LiDAR and UAV photogrammetry surveys are cleaned, brought into a consistent coordinate system, and gridded onto a shared master raster. For each grid cell, the lowest observed elevation across all surveys is retained to approximate the true hard-rock floor over time.
The resulting surface helps separate blast floor from fill, identify areas where material may have been left behind, and provide a more defensible base surface for grade-control models, reconciliation reports, and future design work.
Note: all figures on this page are based on generalized or publicly accessible data. The original survey datasets used for reconciliation are proprietary.
Project Objectives
- Create a consistent, mine-wide elevation grid for the Oak Hill pit using repeated LiDAR/UAV surveys.
- Derive a minimum temporal elevation surface that approximates the true rock floor, independent of temporary fill or stockpiles.
- Enable volumetric comparisons between the minimum surface and geologic models to support reconciliation of ore, waste, and dilution.
- Build a repeatable, script-based workflow in R that can be re-run as new surveys are collected.
Data & Methods
The workflow is implemented in R using a combination of point cloud and raster packages. Individual surveys are processed into DEMs on a unified grid before being merged into a minimum-elevation composite.
Input Data
- LiDAR and UAV photogrammetry point clouds covering the Oak Hill pit and surrounding area.
- Mine planning coordinate system (e.g., NAD27 / New York East) and a defined pit bounding polygon.
- A universal master grid definition (cell size, extent, and CRS) covering the full pit footprint.
Preprocessing
- Reproject all point clouds into the mine planning CRS.
- Clip each survey to the Oak Hill pit AOI to reduce noise outside the mining area.
- Apply point filtering to remove obvious outliers and spurious elevations (e.g., flight artifacts, isolated high/low points).
Per-Survey DEM Generation
- For each cleaned point cloud, interpolate a DEM snapped to the shared master grid (identical origin, cell size, and extent).
- Save each DEM and associated metadata (survey date, source, processing flags) to a structured output directory to keep the time series organized.
Minimum Elevation Composite
- Stack all per-survey DEMs into a raster collection aligned on the master grid.
- Compute the cell-wise minimum elevation across all time steps to produce the Oak Hill Minimum Elevation Surface.
- Export the final surface as a GeoTIFF and as derived products (contours, hillshades, and visualization layers for GIS and mine-planning software).
Applications & Results
The minimum elevation surface is used as a reference floor for volumetric and reconciliation work:
- Comparing geologic ore shells and block models against the minimum surface to estimate mined versus modeled volumes.
- Highlighting areas where the blast floor sits significantly above the minimum rock surface, indicating potential underbreak or dilution.
- Providing more stable base surfaces for long-term reconciliation, reducing the influence of temporary pads, ramps, and backfilled areas.
In practice, this approach tightens the link between surveying, geology, and operations and makes year-over-year reconciliation less sensitive to how individual surveys captured temporary mine features.
Validation
To evaluate how well the minimum elevation surface represents the true rock floor, I plan to collect high-accuracy GPS survey points on exposed, solid bedrock throughout the Oak Hill pit. Points will be distributed across multiple benches and phases, targeting areas with good line-of-sight and minimal loose material.
Each survey point will be compared against the elevation of the minimum surface at the same location. The difference between the GPS elevation and the raster elevation (the residual) will be calculated for every point. These residuals will be summarized using basic statistics (mean error, standard deviation, RMSE) and mapped to highlight where the surface is biased high or low.
This validation step will help identify systematic issues (e.g., interpolation bias, incomplete removal of low outliers, or local grid misalignment) and provide quantitative confidence bounds for using the minimum elevation surface in reconciliation and planning workflows.
Limitations & Next Steps
While the minimum elevation approach works well for isolating a hard-rock floor, there are a few important limitations:
- Survey inconsistencies. Differences in flight paths, sensor types, and point densities can introduce small but systematic elevation offsets between surveys.
- Mixed surfaces in a single cell. In areas with complex bench geometry, a single grid cell can contain points from multiple benches or phases at different times. The minimum value may belong to an older configuration that is no longer relevant.
- Dependence on cleaning. If low outliers are not fully removed, they can be mistaken for true rock surface and pulled into the minimum composite.
- CRS and grid alignment. Any mismatch in projection or grid definition between inputs will undermine the “universal grid” concept and introduce artifacts at edges.
Future improvements could include confidence layers that flag cells with limited temporal coverage, integration of mine design surfaces as additional constraints, and tighter automation for quality checks before each update of the minimum surface.