GIST 604A – Weekly Maps
Maps created throughout GIST 604A Cartography, showing the different cartographic techniques and design concepts covered during the course.
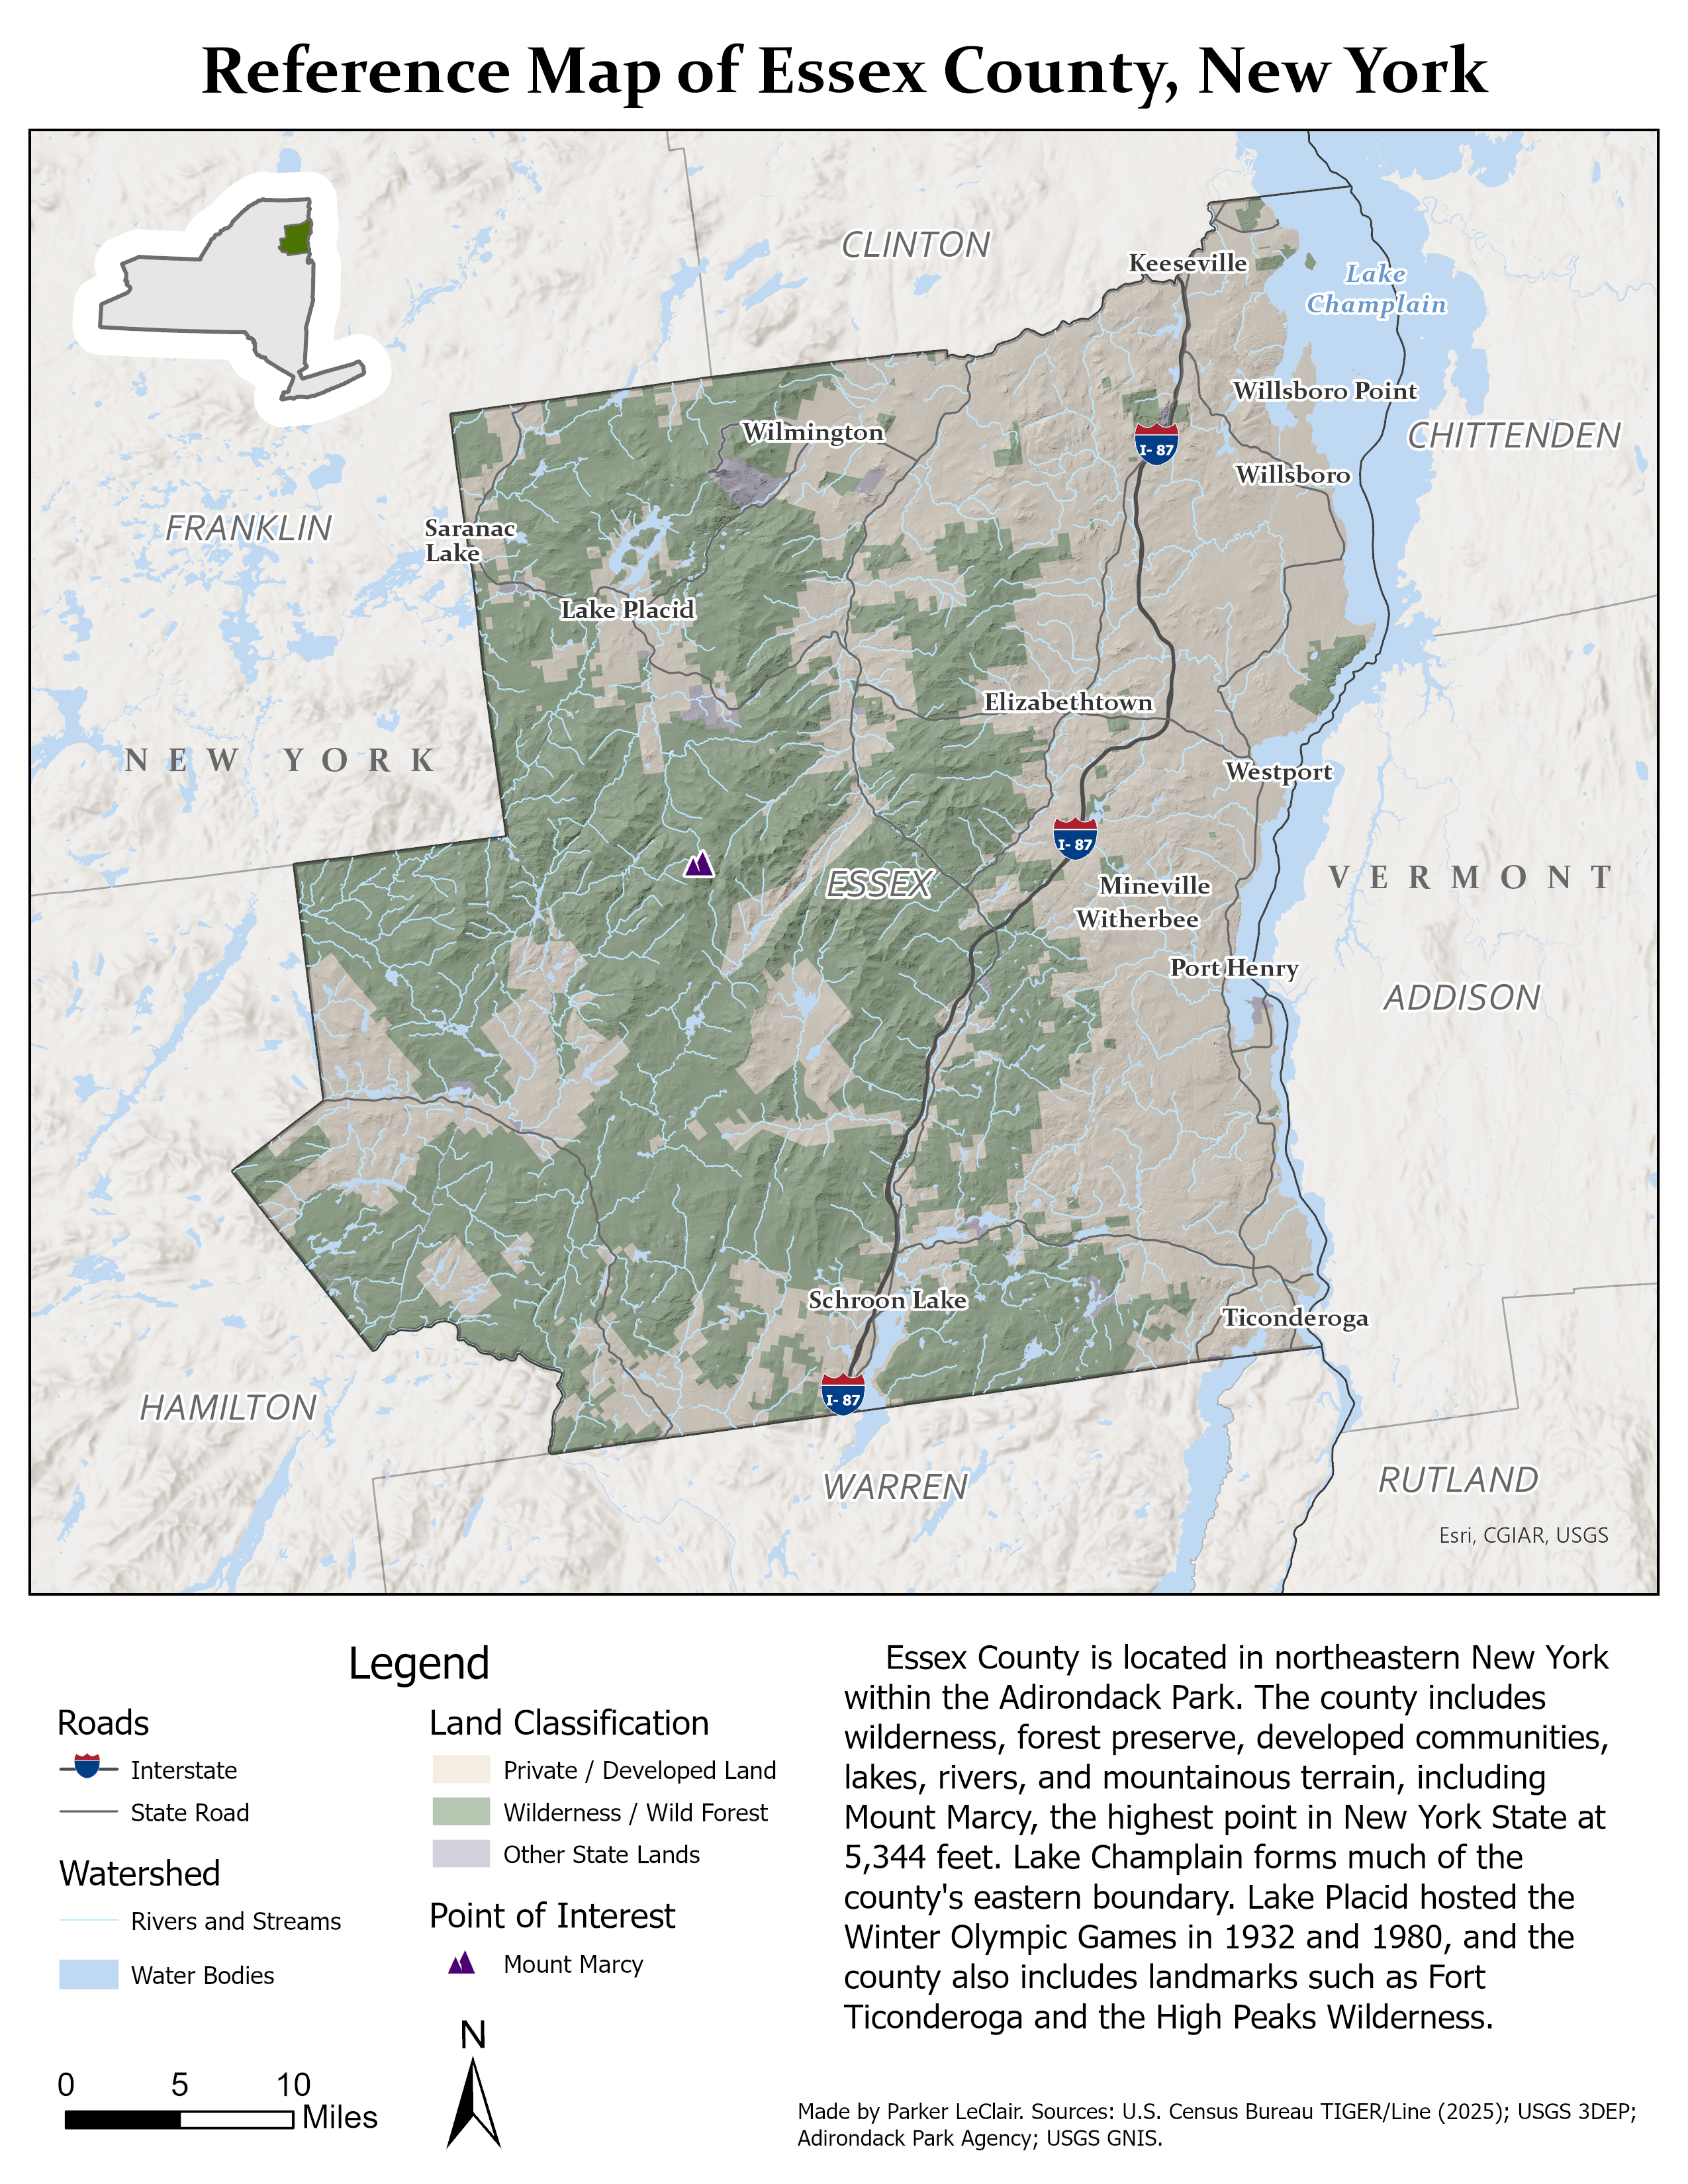
Week 1 – Essex County Reference Map
Topic: Reference mapping and basic cartographic design
The first map focused on building a complete reference map and organizing several types of geographic information into one readable layout. I mapped Essex County, New York using roads, hydrography, land classification, populated places, and Mount Marcy as a point of interest. The main focus was establishing visual hierarchy, creating a usable legend, labeling important features, and balancing the map with supporting layout elements.
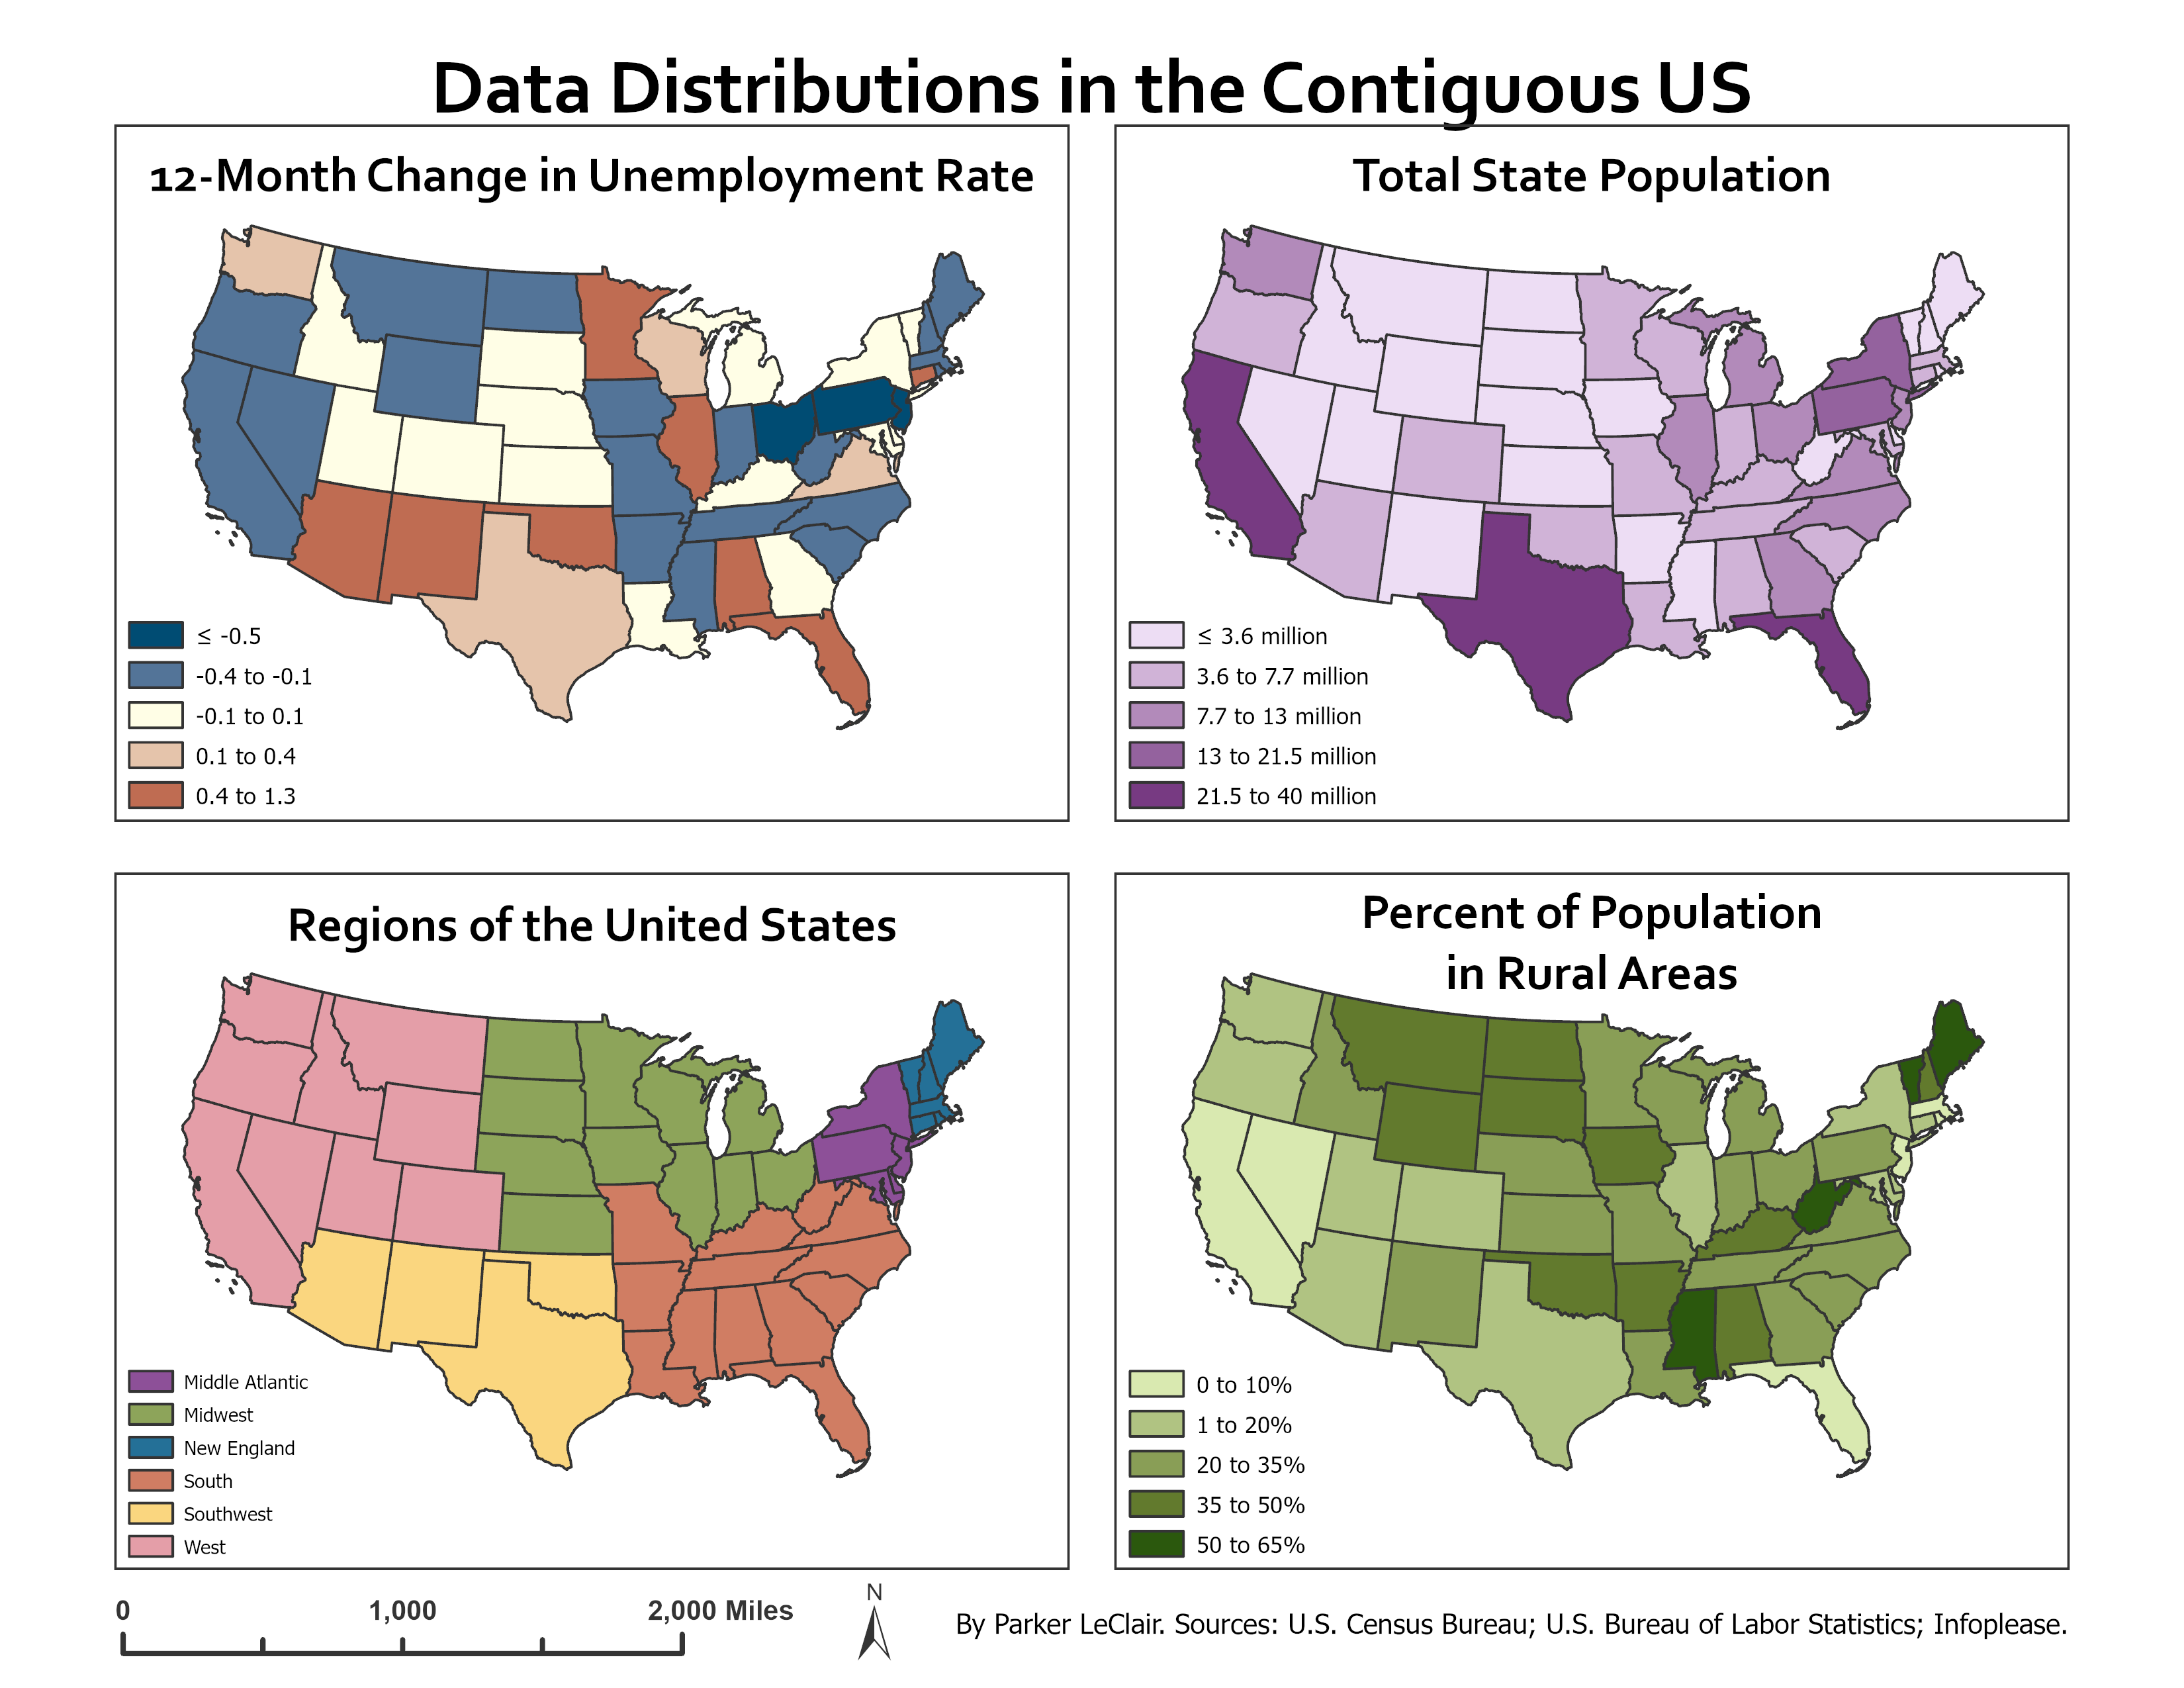
Week 2 – U.S. Data Distributions
Topic: Choropleth maps, classification, and qualitative vs. quantitative color
This assignment compared several ways of symbolizing state-level data. The four maps show change in unemployment rate, total population, U.S. regions, and the percentage of the population living in rural areas. The exercise focused on choosing appropriate classification methods and color schemes for different kinds of data, including sequential, diverging, and qualitative datasets.
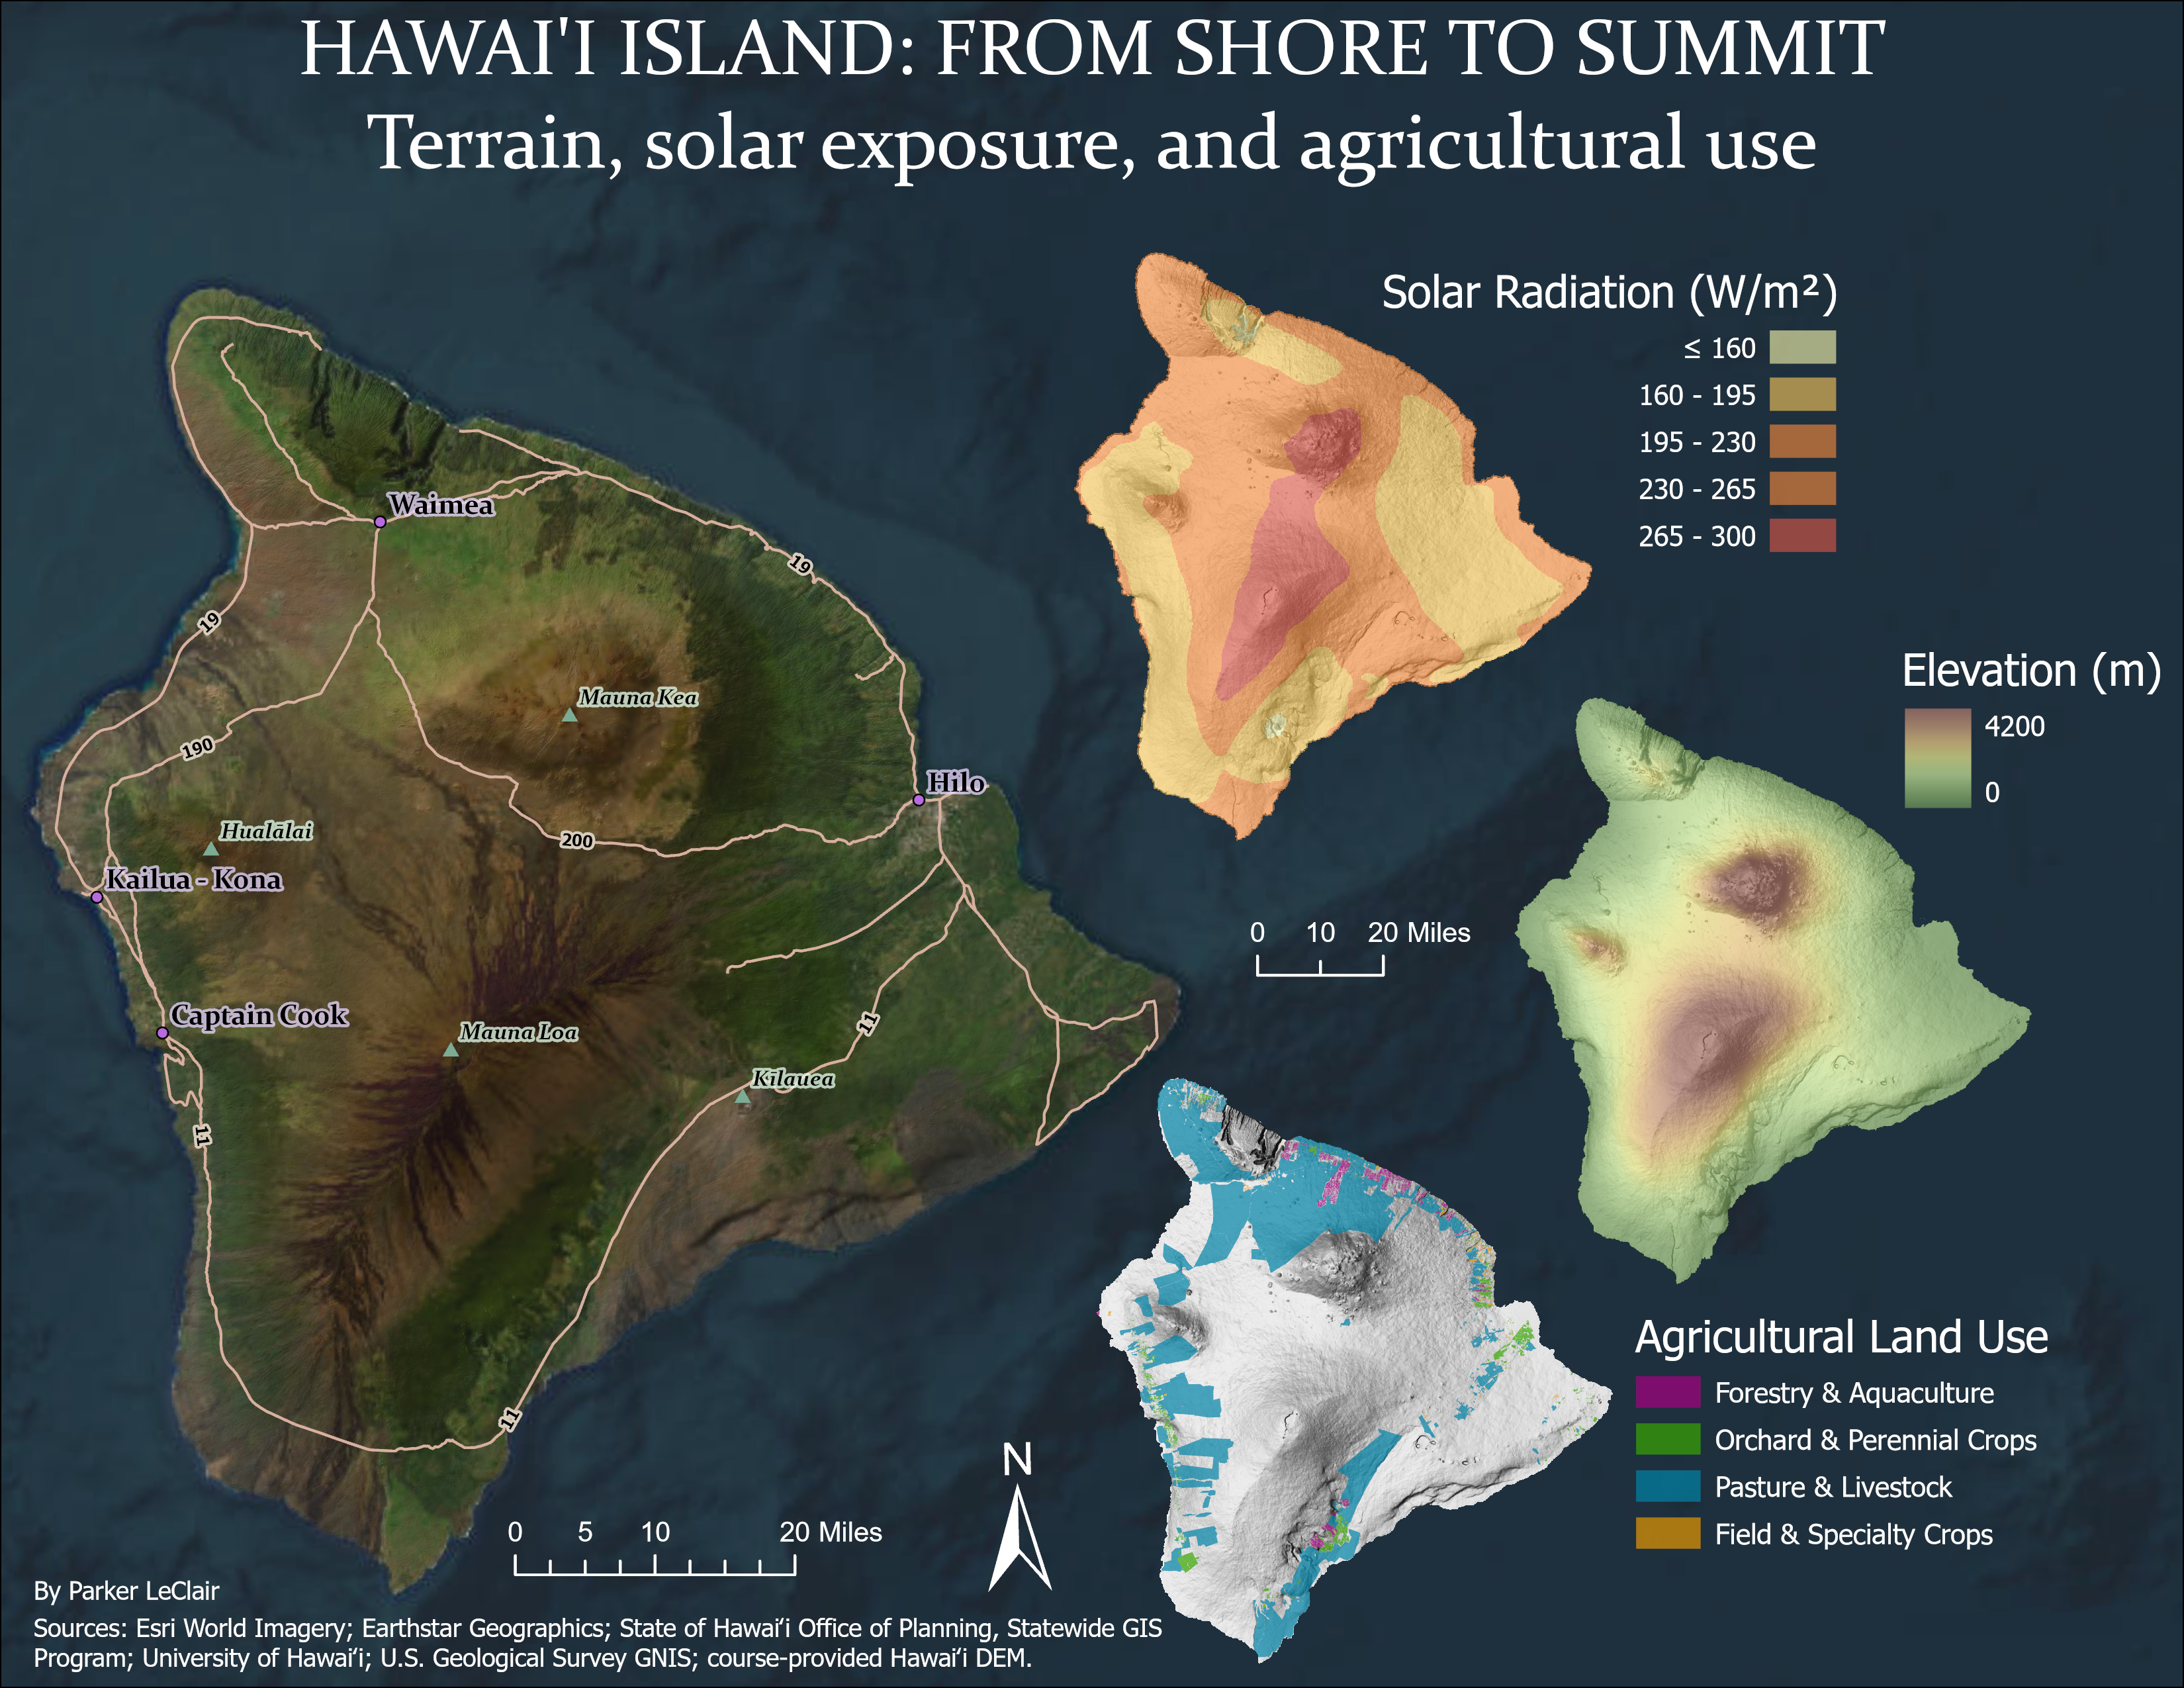
Week 3 – Hawaiʻi Island: Color and Texture
Topic: Color, terrain representation, and visual texture
This week focused on using color and texture to represent several different kinds of geographic information. My Hawaiʻi Island layout combines imagery with separate maps of solar radiation, elevation, and agricultural land use. The goal was to use color intentionally while allowing the terrain and underlying surface texture to remain visible, especially in the elevation and land-use maps.
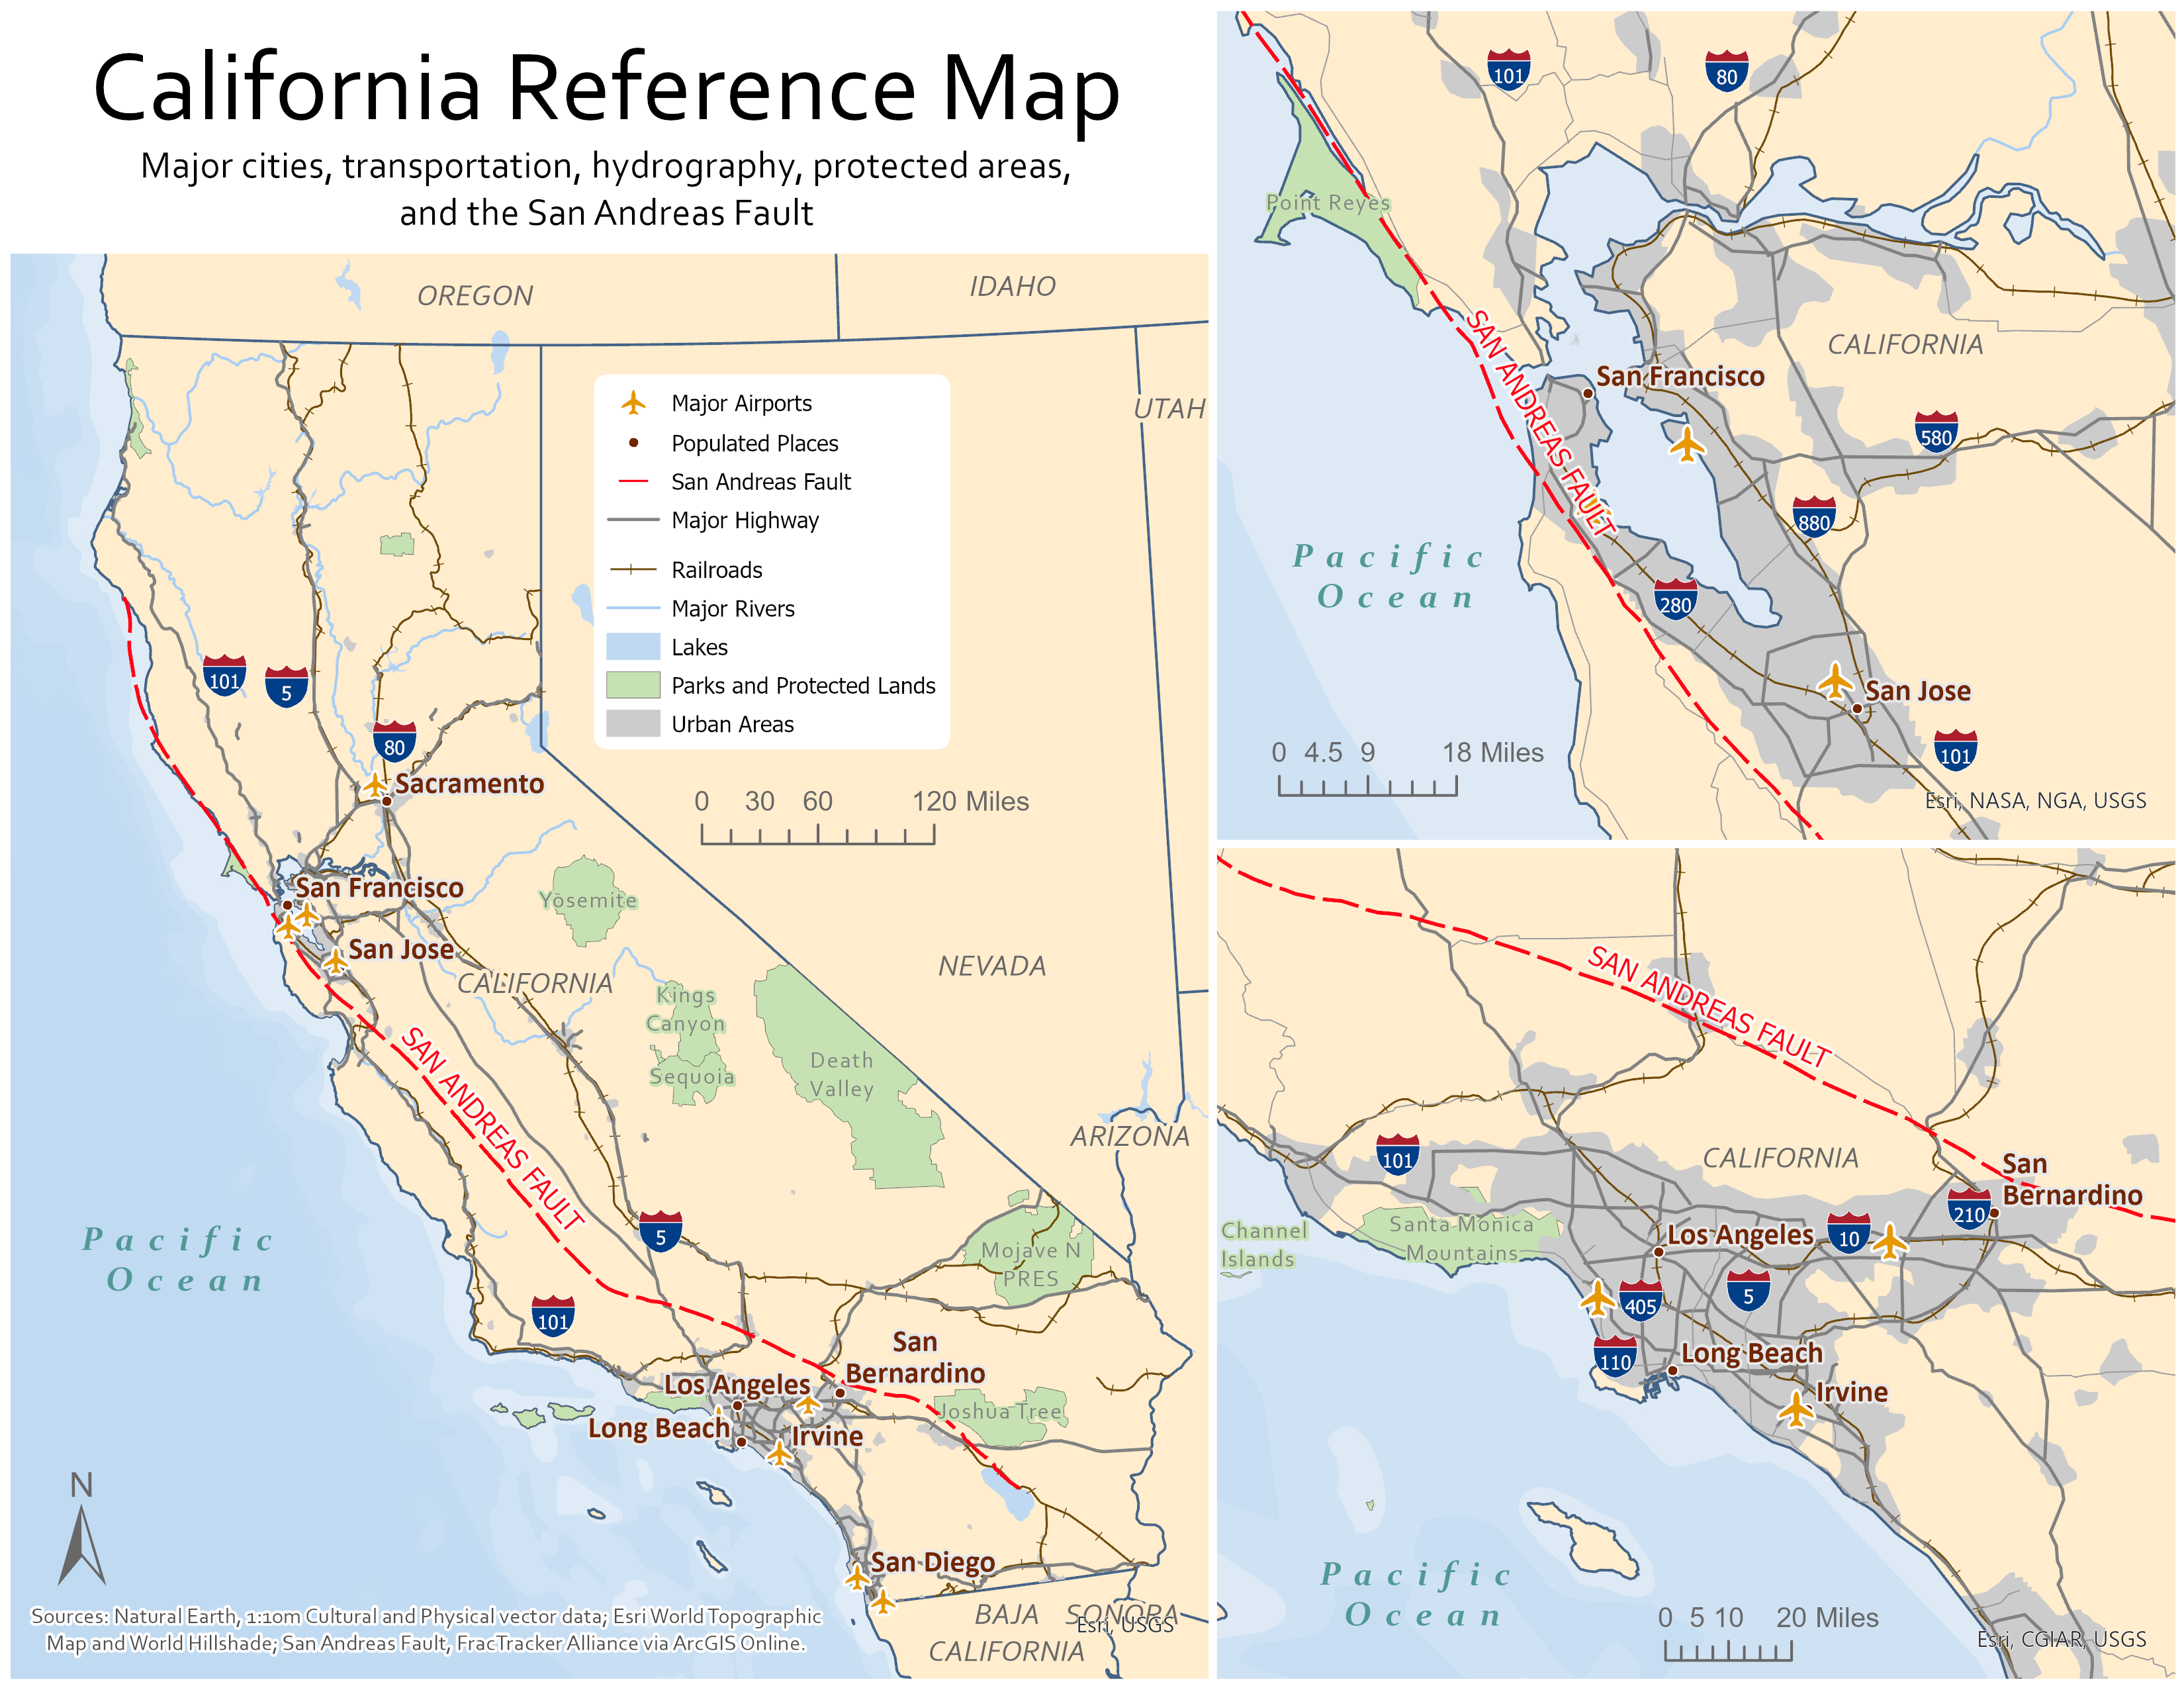
Week 4 – California Reference Map
Topic: Reference-map design, labeling, and visual hierarchy
For this assignment I created a statewide reference map of California along with detailed views of the San Francisco Bay Area and Southern California. The map combines cities, airports, highways, railroads, rivers, lakes, protected lands, urban areas, and the San Andreas Fault. The main challenge was organizing a large number of reference features without allowing any one layer to overwhelm the map.
Week 5 – 2012 Presidential Election
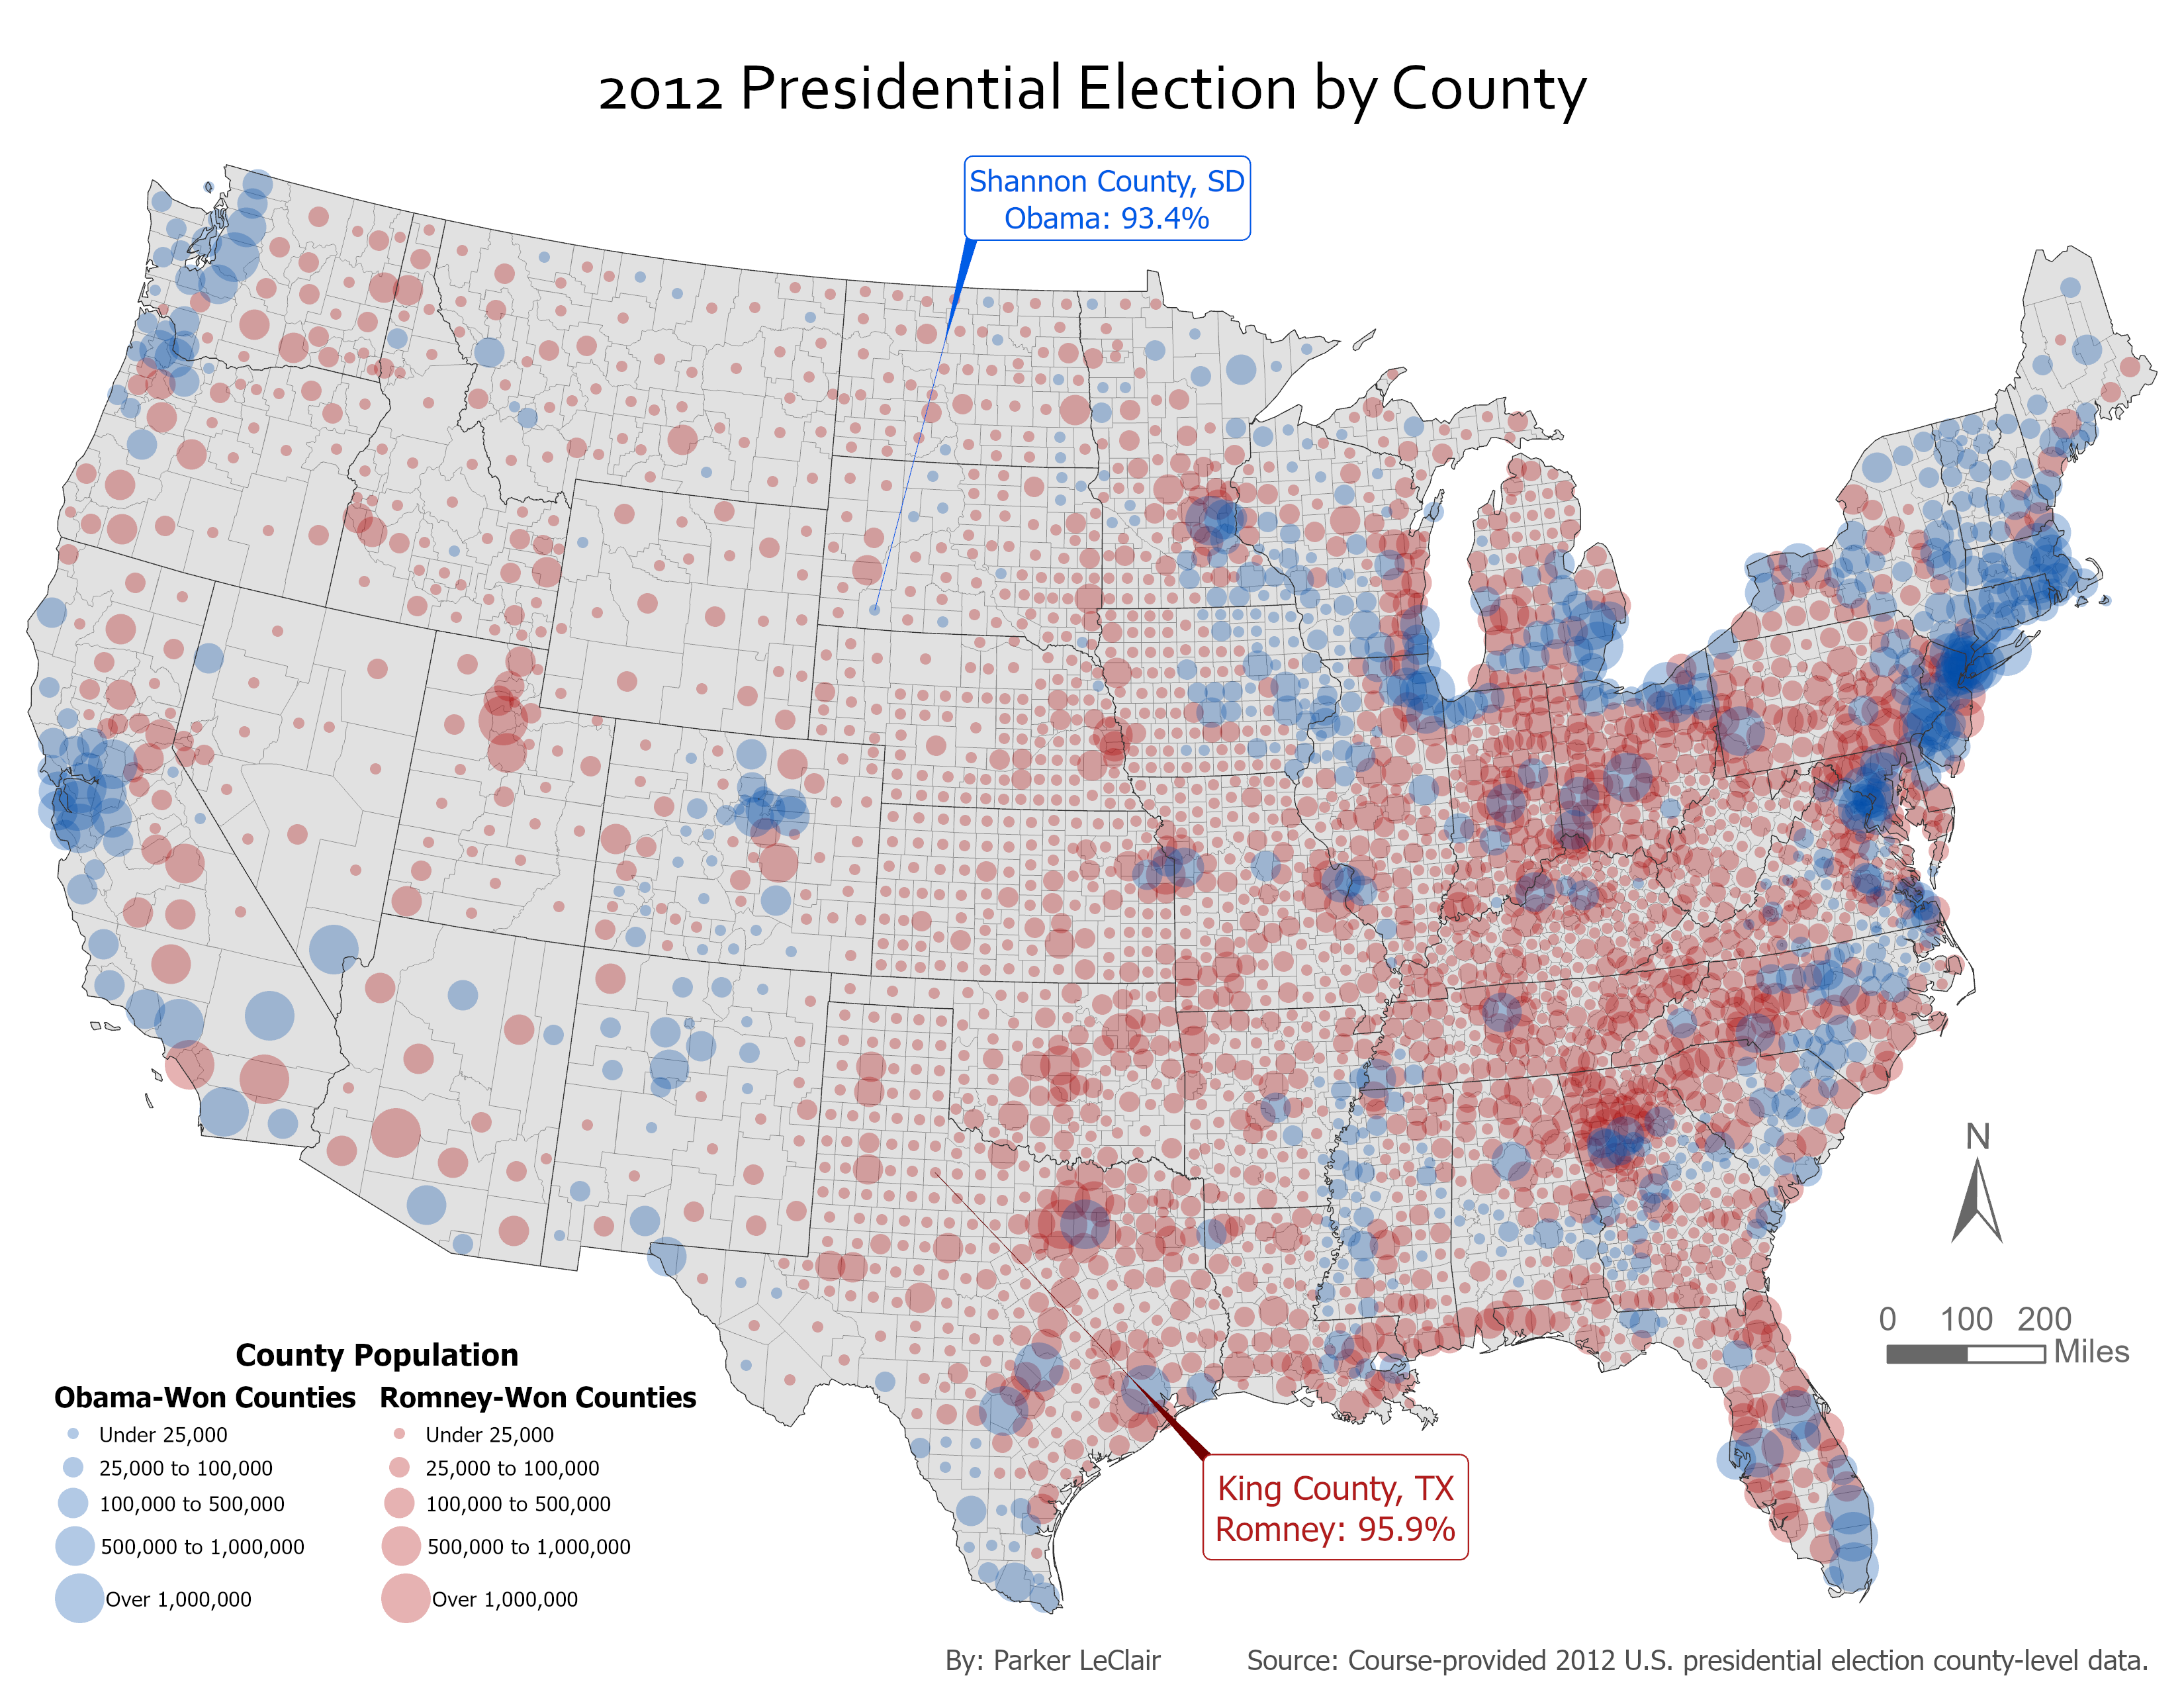
Topic: Proportional symbols and multivariate thematic mapping
This map uses graduated circle size to represent county population while color shows whether Barack Obama or Mitt Romney won each county in the 2012 presidential election. Combining two variables in the same symbol made it possible to show both the geographic pattern of the election and the large differences in population between counties. The assignment also explored annotation by highlighting counties with especially high vote percentages for each candidate.
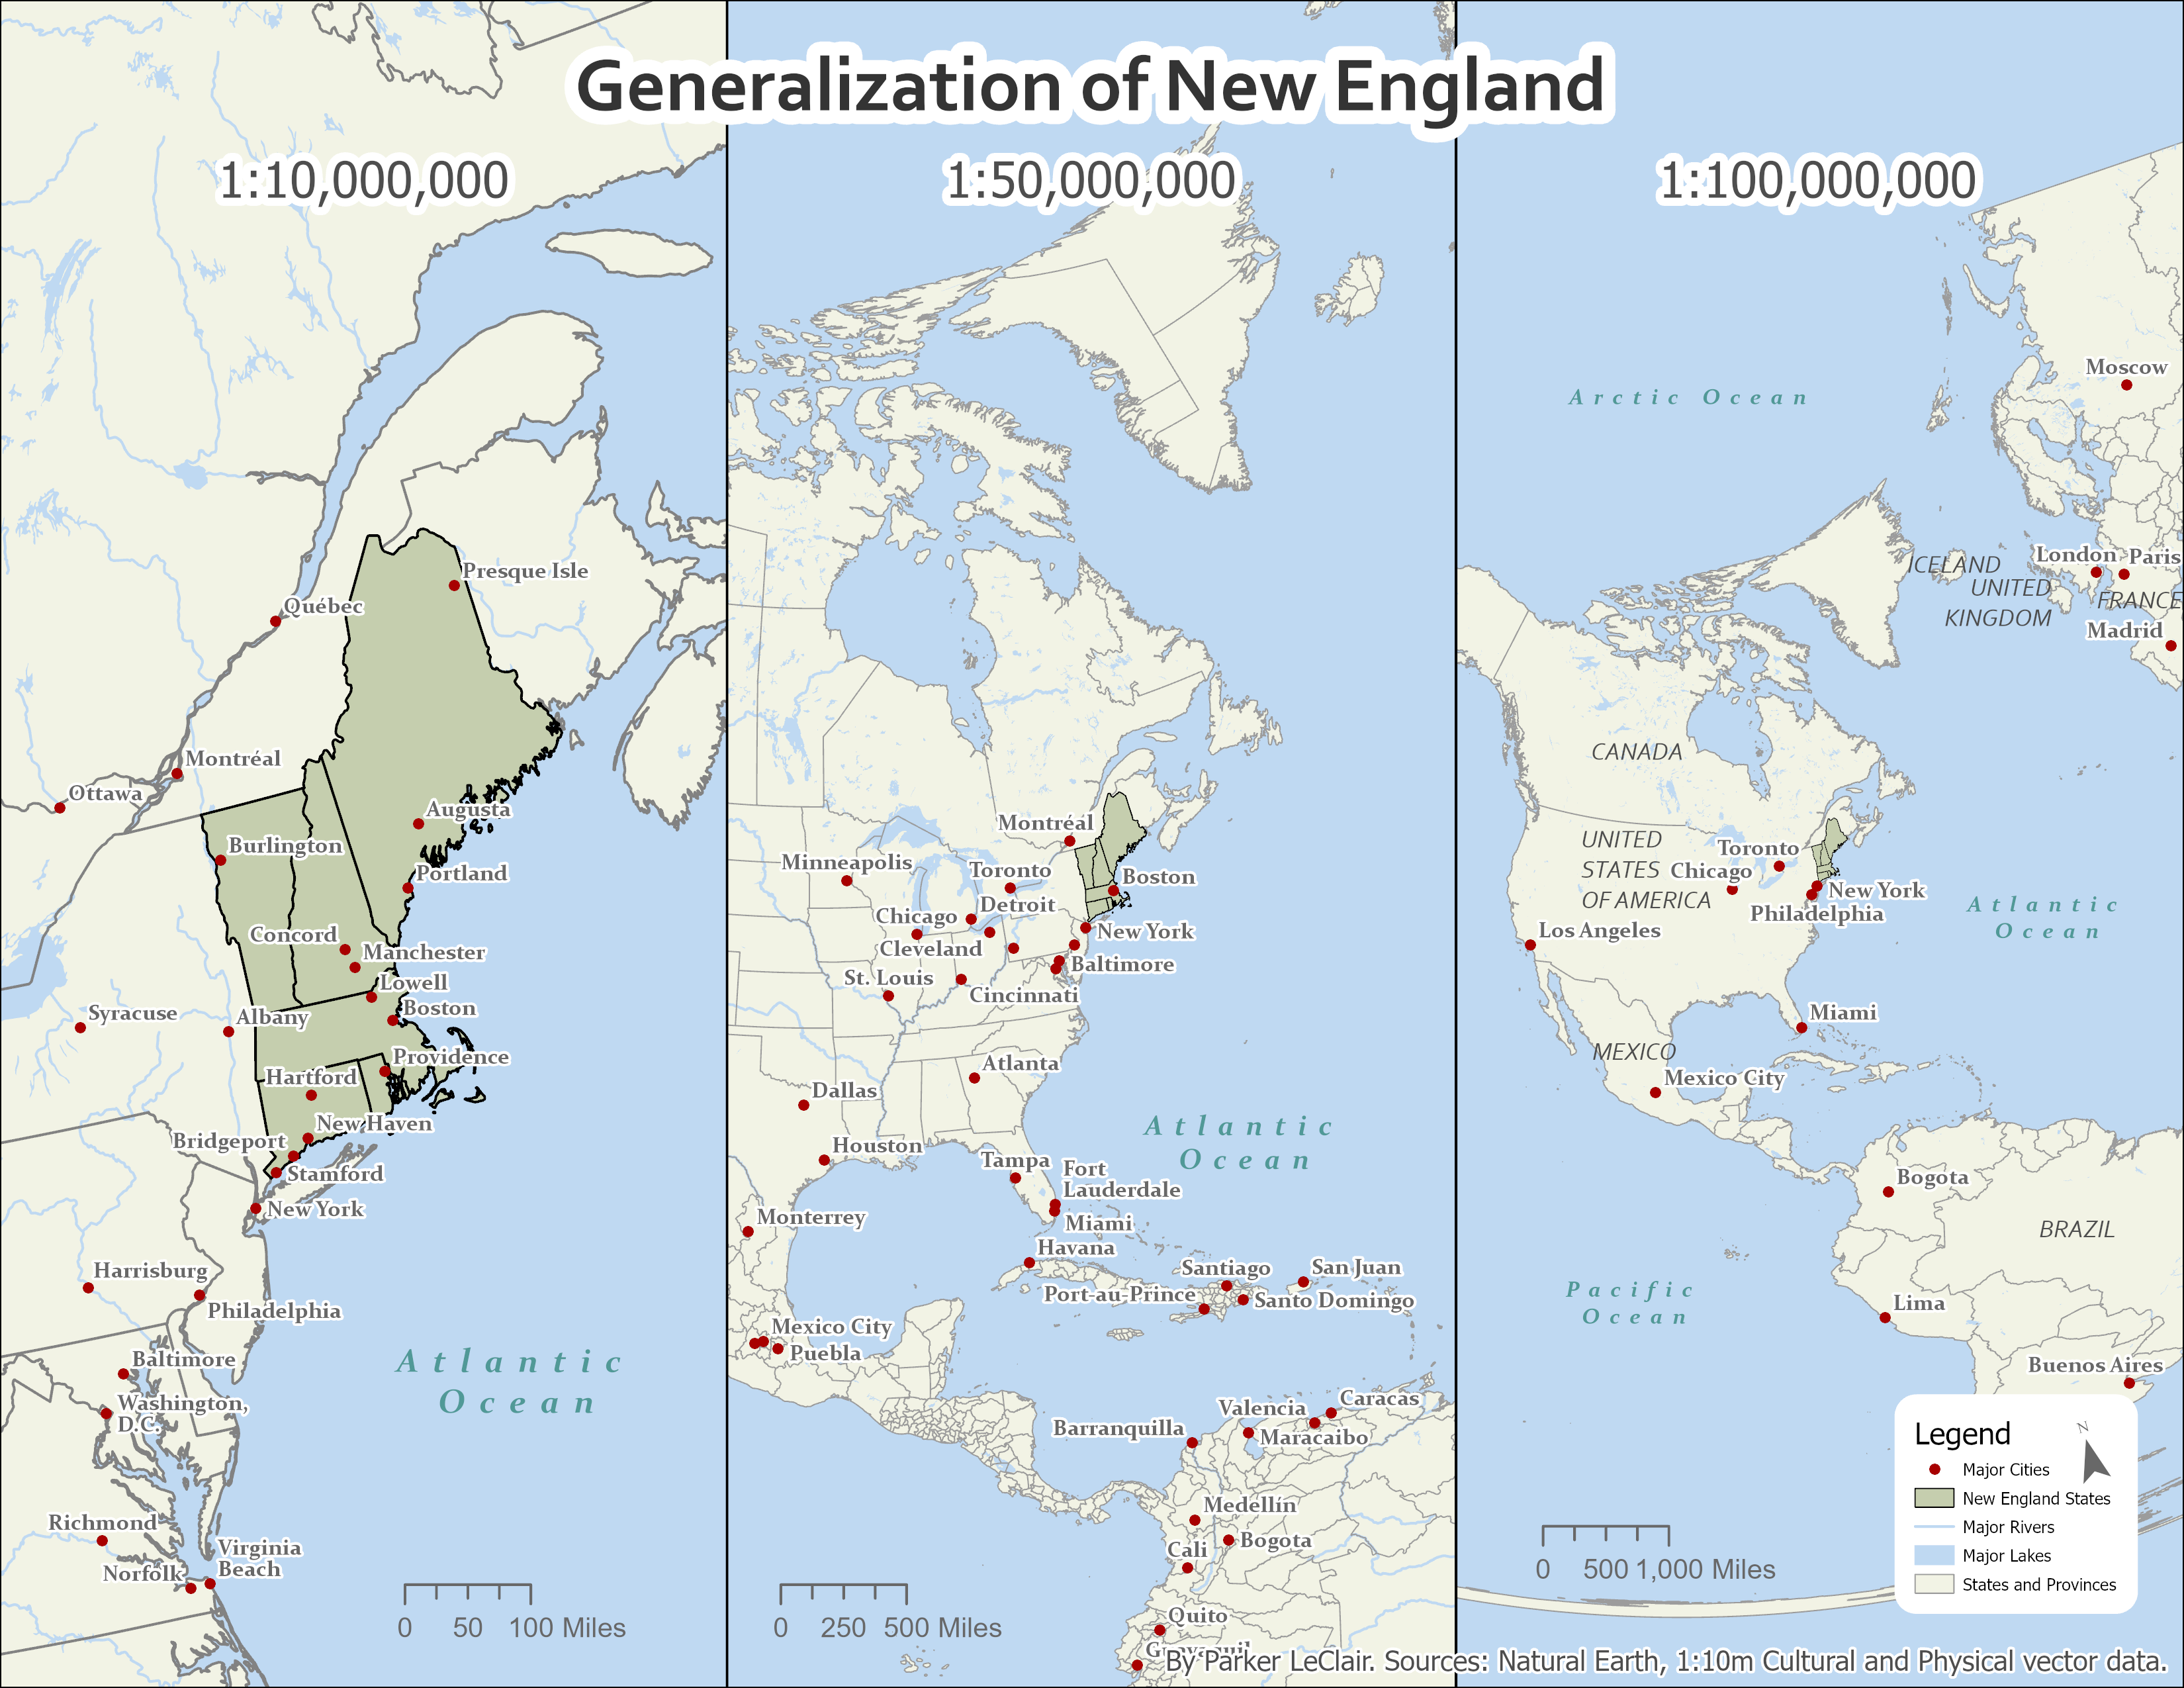
Week 6 – Generalization of New England
Topic: Map scale and cartographic generalization
The final weekly exercise looked at how the amount of detail shown on a map should change with scale. I displayed the same New England region at 1:10,000,000, 1:50,000,000, and 1:100,000,000. As the map scale becomes smaller, geographic features, labels, and reference information have to be simplified or removed to keep the map readable. This exercise directly influenced the amount of generalization I used later in my final Adirondack geology project.